Market Wrap: Stocks, Bonds, Commodities
Stock futures rose modestly on Sunday night as investors readied for a week with more corporate earnings and key inflation readings.
The Dow Jones Industrial Average fell 150.27 points to 35,065.62, the S&P 500 lose 0.53% to 4,478.03 and the Nasdaq Composite subtract 50.48 points to 13,909.20.
MSCI’s index of Asia-Pacific stocks outside Japan is advance 0.04% to 648.41 levels. The Australian index was lower by 0.22% to 7,309.20. Japanese Nikkei Index ascend 0.29% today.
European stocks were negative on Monday, with the Stoxx Europe 50 Index fell 0.51% to 4,310.95, Germany’s DAX drop 0.47% to 15,873.05, and France’s CAC decline 0.45% to 7,282.33 and U.K.’s FTSE 100 subtract 0.48% to 7,528.05.
Benchmark 10-year U.S. Treasury fell as demand for safe assets ascend again, today 10-year bond yields positive 0.89% to 4.0980.
Oil prices rose more than a dollar a barrel on Friday to record a sixth consecutive week of gains, after top producers Saudi Arabia and Russia extended supply cuts through September, adding to undersupply concerns.
Spot Brent crude oil drop 0.79% to $85.56 per barrel. US West Texas Intermediate crude is up 0.86% to $82.14 a barrel.
The yellow metal gold is decline 0.26% to 1,970.90 dollars per ounce.
Market Wrap: Forex
The U.S. dollar gained in early European trade Monday, rebounding from losses after Friday’s payrolls data ahead of this week’s release of inflation data from the world’s two largest economies.
Today, the U.S. dollar index measures the Greenback against a trade-weighted basket of six major currencies, which surged 0.25% to 102.085.
The Euro US Dollar (EUR/USD) is a widely traded pair that is down 0.28% today. This left the pair trading around $1.09780.
The Japanese yen was negative against the U.S. dollar on Monday. Today USD/JPY is surged 0.39% to the 142.310 level.
Another commodity-related currency negative against the U.S dollar, AUD/USD fell 0.07% to 0.65640, and NZD/USD slipped 0.07% to 0.60950 level.
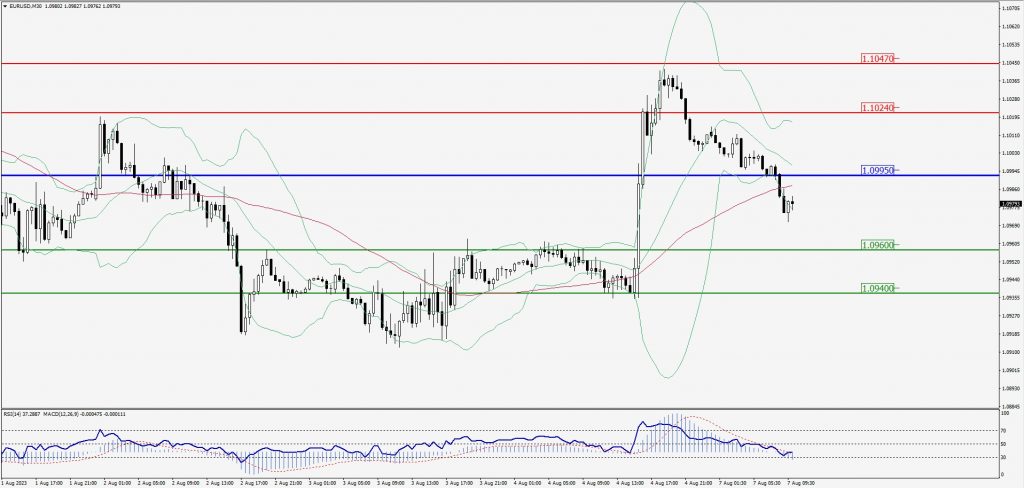
EUR/USD Intraday: Trend on the downside
Our pivot point is at 1.09950
Preferable Price Action: Take sell positions below pivot level with targets at 1.09600 & 1.09400 in extension.
Alternative Price Action: Above pivot looks for a further upside to 1.10240 & 1.10470.
Comment: RSI is below 50 levels and Pairs below its 20MA & 55MA.
Green Lines Indicate Resistance Levels – Red Lines Indicate Support Levels
Light Blue is a Pivot Point – Black represents the price when the report was produced
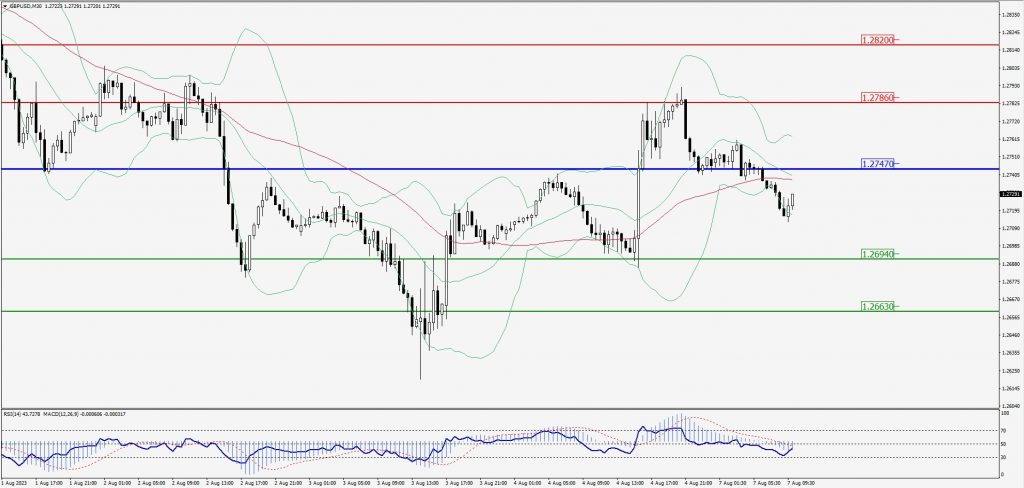
GBP/USD Intraday: Trend on the downside
Our pivot point is at 1.27470
Preferable Price Action: Sell positions below pivot with targets at 1.26940 & 1.26630 in extension.
Alternative Price Action: The price above pivot would call for further upside to 1.27860 & 1.28200.
Comment: RSI is below 50 levels and Pairs below its 20MA & 55MA.
Green Lines Indicate Resistance Levels – Red Lines Indicate Support Levels
Light Blue is a Pivot Point – Black represents the price when the report was produced
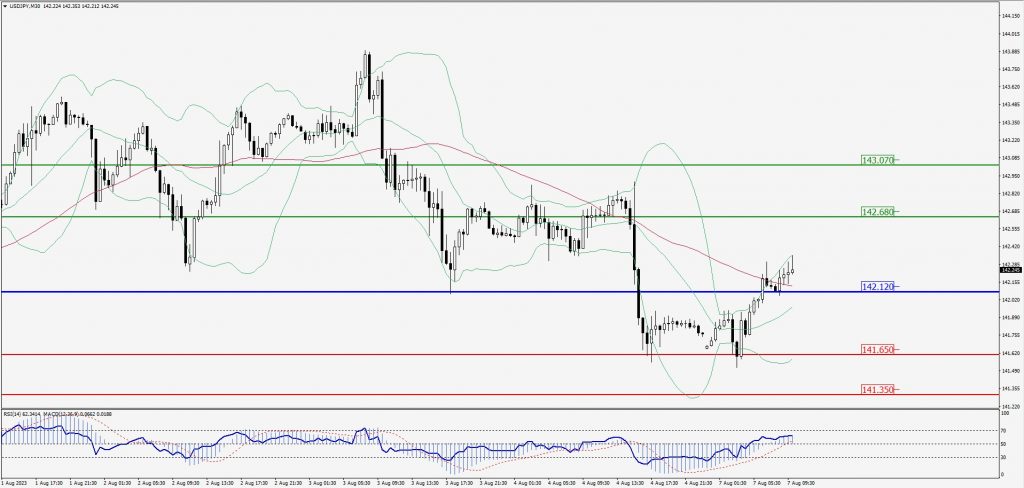
USD/JPY Intraday: Trend on the upside
Our pivot point is at 142.120
Preferable Price Action: Buy position above pivot with the target at 142.680 and 143.070 in extension.
Alternative Price Action: The downside breakout of the pivot would call for 141.650 and 141.350.
Comment: MACD is above 50 level and Pairs above its 20MA & 55MA.
Green Lines Indicate Resistance Levels – Red Lines Indicate Support Levels
Light Blue is a Pivot Point – Black represents the price when the report was produced
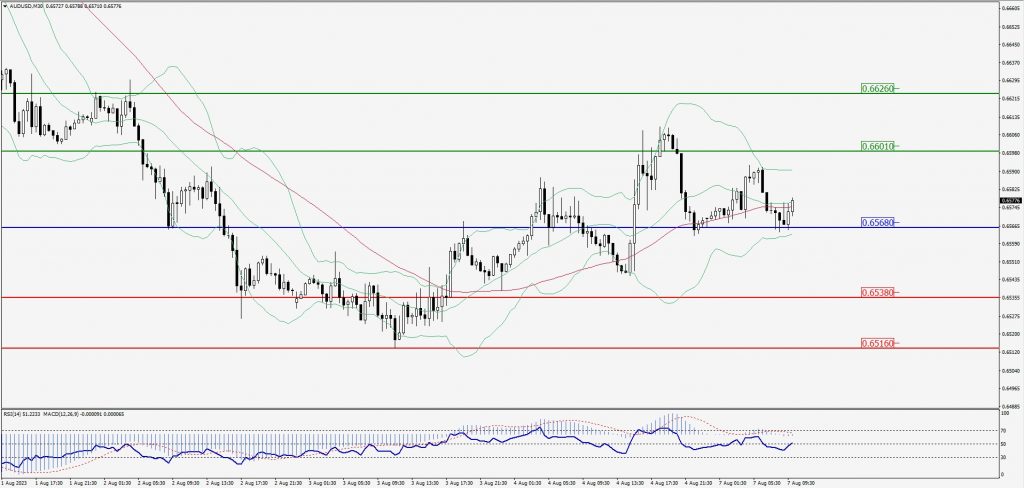
AUD/USD Intraday: Support level at 0.65680
Our pivot point is at 0.65680
Preferable Price Action: Buy positions above pivot with targets at 0.66010 & 0.66260 in extension.
Alternative Price Action: Below pivot looks for a further downside with 0.65380 & 0.65160 as targets.
Comment: RSI is at 50 levels.
Green Lines Indicate Resistance Levels – Red Lines Indicate Support Levels
Light Blue is a Pivot Point – Black represents the price when the report was produced
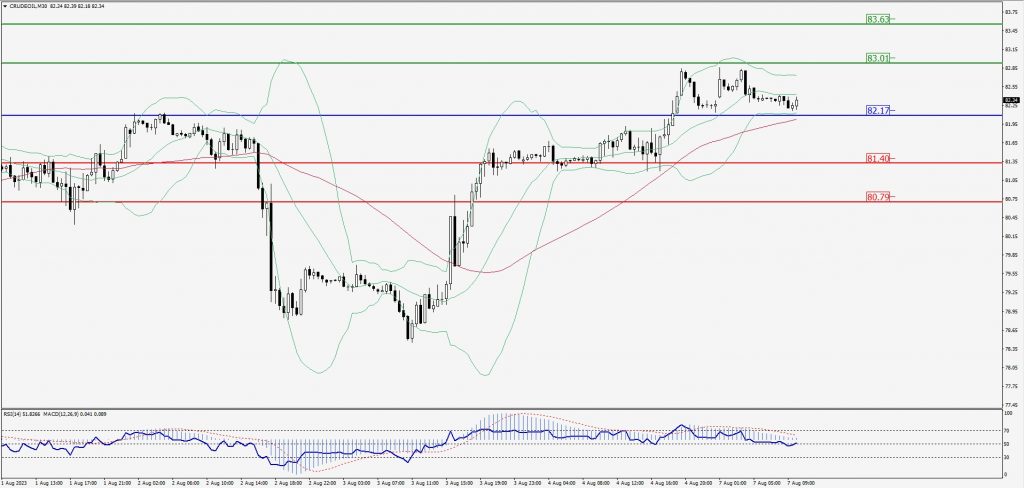
CRUDEOIL Intraday: Trend on the upside
Our pivot point is at 82.17
Preferable Price Action: Above pivot buy oil with 83.01 & 83.63 as targets.
Alternative Price Action: Sell crude below pivot with targets at 81.40 and 80.79 in extension.
Comment: MACD is positive territory and Pairs above 55MA.
Green Lines Indicate Resistance Levels – Red Lines Indicate Support Levels
Light Blue is a Pivot Point – Black represents the price when the report was produced
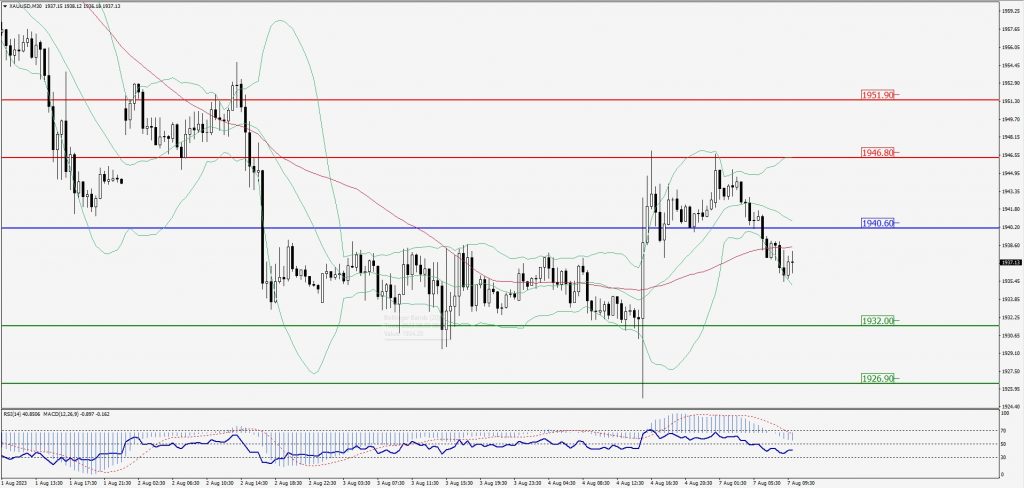
XAU/USD Intraday: Trend on the downside
Our pivot point is 1940.60
Preferable Price Action: Further downside to 1932.00 and 1926.90.
Alternative Price Action: If the price gives an upside breakout of a pivot, then the price extends to 1946.80 and 1951.90.
Comment: MACD is below 50 level and Pairs below its 20MA & 55MA.
Green Lines Indicate Resistance Levels – Red Lines Indicate Support Levels
Light Blue is a Pivot Point – Black represents the price when the report was produced
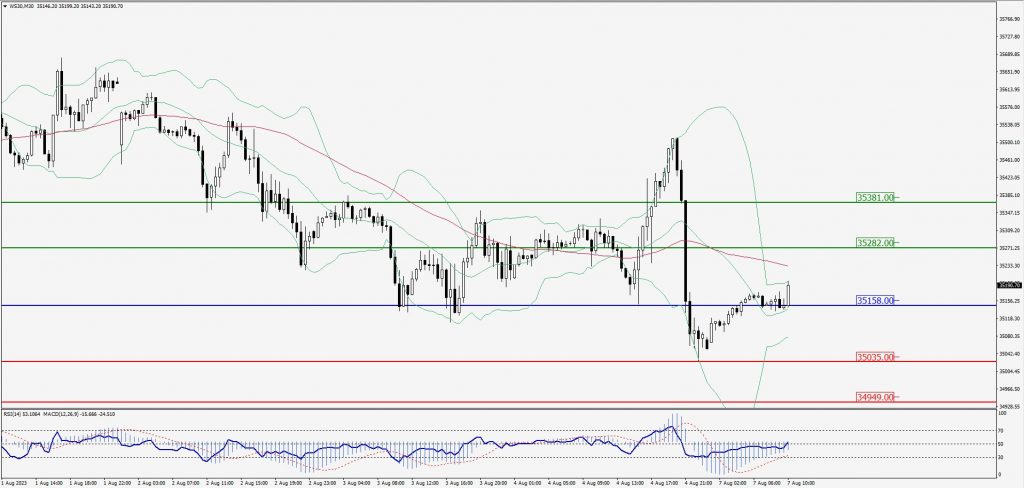
Dow Jones Intraday: In a consolidation zone
Our pivot point is 35,158.00
Preferable Price Action: Take buy positions above the pivot with targets at 35,282.00 & 35,381.00.
Alternative Price Action: Below 35,158.00 looks for further downside to 35,035.00 & 34,949.00.
Comment: RSI is at 50 levels and Pairs above 20MA.
Green Lines Indicate Resistance Levels – Red Lines Indicate Support Levels
Light Blue is a Pivot Point – Black represents the price when the report was produced