Market Wrap: Stocks, Bonds, Commodities
Nasdaq 100 futures ticked higher Thursday night as Wall Street parsed the latest earnings from big-name technology companies in the runup to a major employment report due Friday morning.
The Dow Jones Industrial Average fell 66.63 points to 35,215.89, the S&P 500 lose 0.25% to 4,501.89 and the Nasdaq Composite subtract 13.73 points to 13,959.71.
MSCI’s index of Asia-Pacific stocks outside Japan is advance 0.03% to 648.88 levels. The Australian index was higher by 0.19% to 7,325.30. Japanese Nikkei Index drop 0.02% today.
European stocks were positive on Friday, with the Stoxx Europe 50 Index rose 0.43% to 4,323.25, Germany’s DAX ascend 0.04% to 15,899.15, and France’s CAC advance 0.48% to 7,294.96 and U.K.’s FTSE 100 add 0.03% to 7,530.95.
Benchmark 10-year U.S. Treasury fell as demand for safe assets ascend again, today 10-year bond yields positive 0.12% to 4.1960.
Oil prices gained about 2% on Thursday as Saudi Arabia and Russia took steps to keep supplies tight into September and possibly beyond.
Spot Brent crude oil ascend 0.59% to $85.64 per barrel. US West Texas Intermediate crude is up 0.63% to $82.06 a barrel.
The yellow metal gold is decline 0.01% to 1,968.70 dollars per ounce.
Market Wrap: Forex
The dollar rested below the previous day’s four-week high against major peers on Friday as investors looked ahead to the jobs report due later in the day that could influence the path for U.S. interest rates and recently volatile Treasuries.
Today, the U.S. dollar index measures the Greenback against a trade-weighted basket of six major currencies, which surged 0.03% to 102.370.
The Euro US Dollar (EUR/USD) is a widely traded pair that is down 0.02% today. This left the pair trading around $1.09420.
The Japanese yen was negative against the U.S. dollar on Friday. Today USD/JPY is surged 0.17% to the 142.780 level.
Another commodity-related currency mixed against the U.S dollar, AUD/USD rose 0.09% to 0.65580, and NZD/USD slipped 0.02% to 0.60760 level.
EUR/USD Intraday: In a consolidation zone
Our pivot point is at 1.09610
Preferable Price Action: Take sell positions below pivot level with targets at 1.09260 & 1.09020 in extension.
Alternative Price Action: Above pivot looks for a further upside to 1.09890 & 1.10090.
Comment: RSI is at 50 levels and Pairs below 20MA.
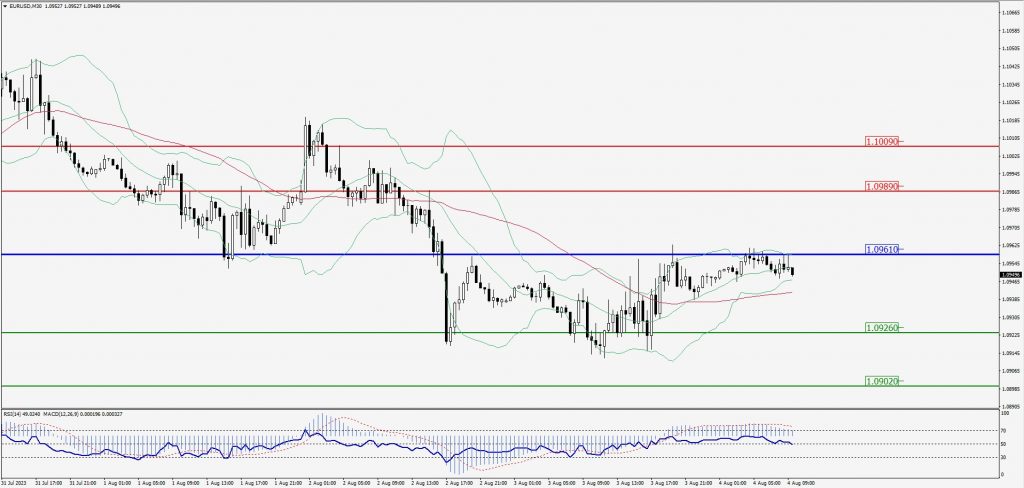
Green Lines Indicate Resistance Levels – Red Lines Indicate Support Levels
Light Blue is a Pivot Point – Black represents the price when the report was produced
GBP/USD Intraday: In a consolidation zone
Our pivot point is at 1.27340
Preferable Price Action: Sell positions below pivot with targets at 1.26740 & 1.26350 in extension.
Alternative Price Action: The price above pivot would call for further upside to 1.27840 & 1.28200.
Comment: RSI is at 50 levels and Pairs below 20MA.
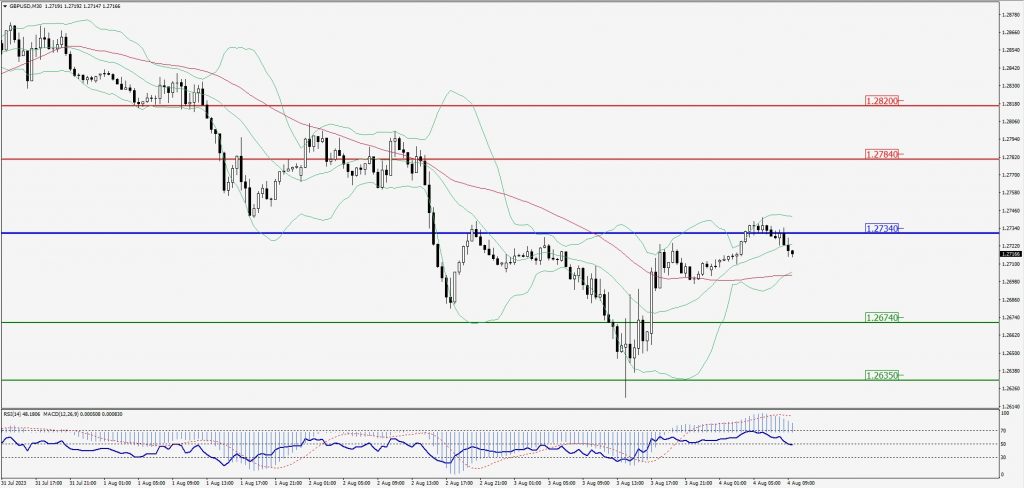
Green Lines Indicate Resistance Levels – Red Lines Indicate Support Levels
Light Blue is a Pivot Point – Black represents the price when the report was produced
USD/JPY Intraday: Trend on the downside
Our pivot point is at 142.770
Preferable Price Action: Sell position below pivot with the target at 142.250 and 141.930 in extension.
Alternative Price Action: The upside breakout of the pivot would call for 143.190 and 143.520.
Comment: MACD is below 50 level and Pairs below 55MA.
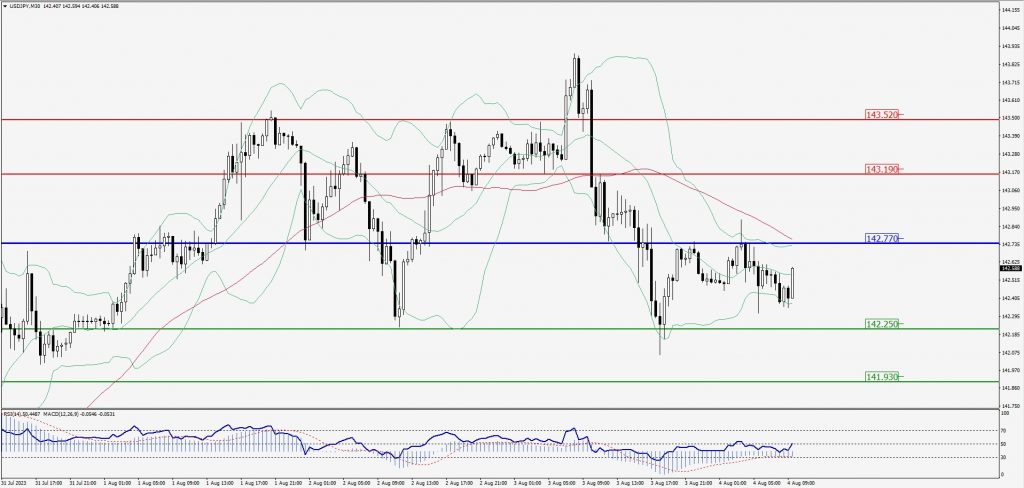
Green Lines Indicate Resistance Levels – Red Lines Indicate Support Levels
Light Blue is a Pivot Point – Black represents the price when the report was produced
AUD/USD Intraday: Trend on the upside
Our pivot point is at 0.65580
Preferable Price Action: Buy positions above pivot with targets at 0.66110 & 0.66440 in extension.
Alternative Price Action: Below pivot looks for a further downside with 0.65100 & 0.64810 as targets.
Comment: RSI is above 50 levels and Pairs above 55MA.
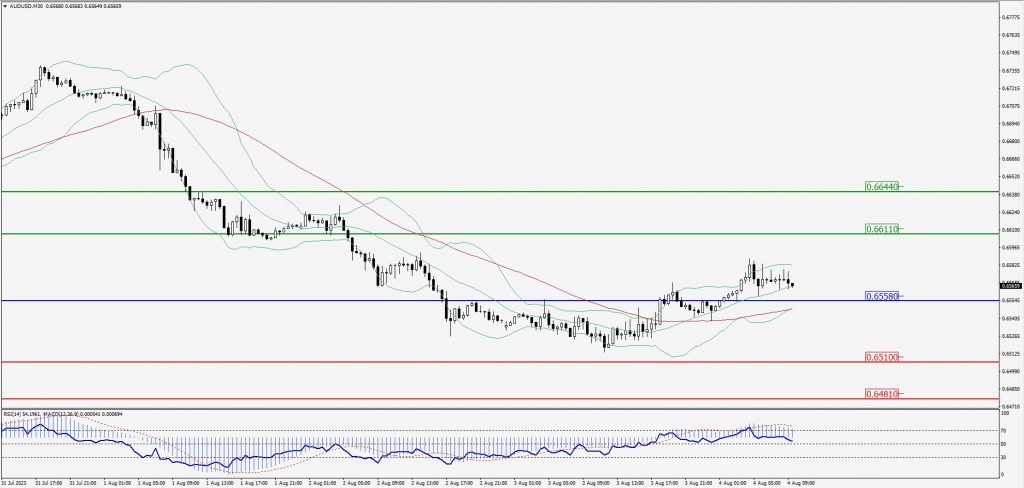
Green Lines Indicate Resistance Levels – Red Lines Indicate Support Levels
Light Blue is a Pivot Point – Black represents the price when the report was produced
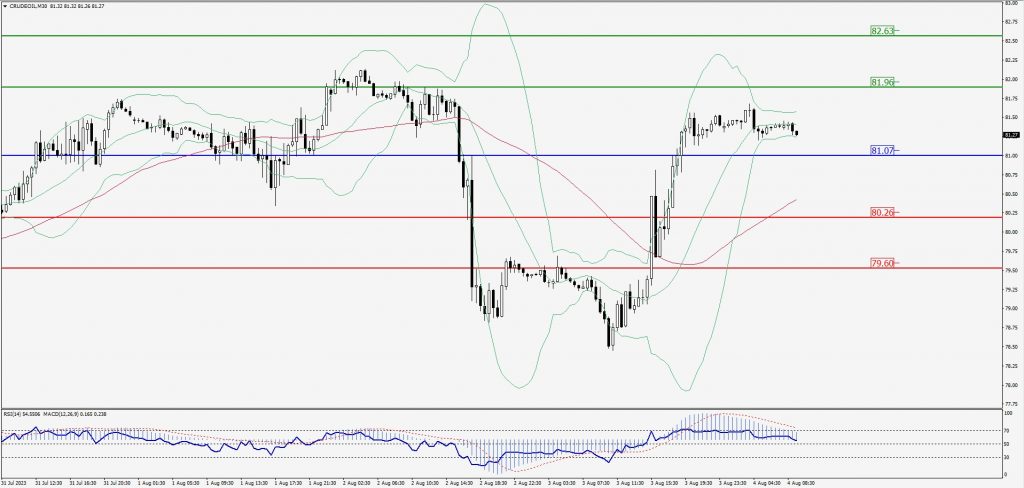
CRUDEOIL Intraday: Trend on the upside
Our pivot point is at 81.07
Preferable Price Action: Above pivot buy oil with 81.96 & 82.63 as targets.
Alternative Price Action: Sell crude below pivot with targets at 80.26 and 79.60 in extension.
Comment: MACD is positive territory and Pairs above 55MA.
Green Lines Indicate Resistance Levels – Red Lines Indicate Support Levels
Light Blue is a Pivot Point – Black represents the price when the report was produced
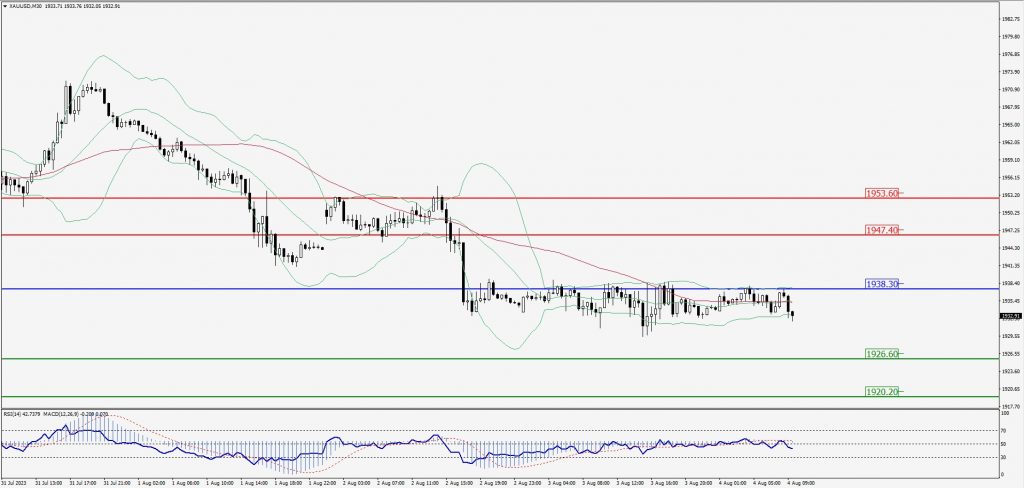
XAU/USD Intraday: Major resistance level at 1938.30
Our pivot point is 1938.30
Preferable Price Action: Further downside to 1926.60 and 1920.20.
Alternative Price Action: If the price gives an upside breakout of a pivot, then the price extends to 1947.40 and 1953.60.
Comment: MACD is below 50 level and Pairs below its 20MA & 55MA.
Green Lines Indicate Resistance Levels – Red Lines Indicate Support Levels
Light Blue is a Pivot Point – Black represents the price when the report was produced
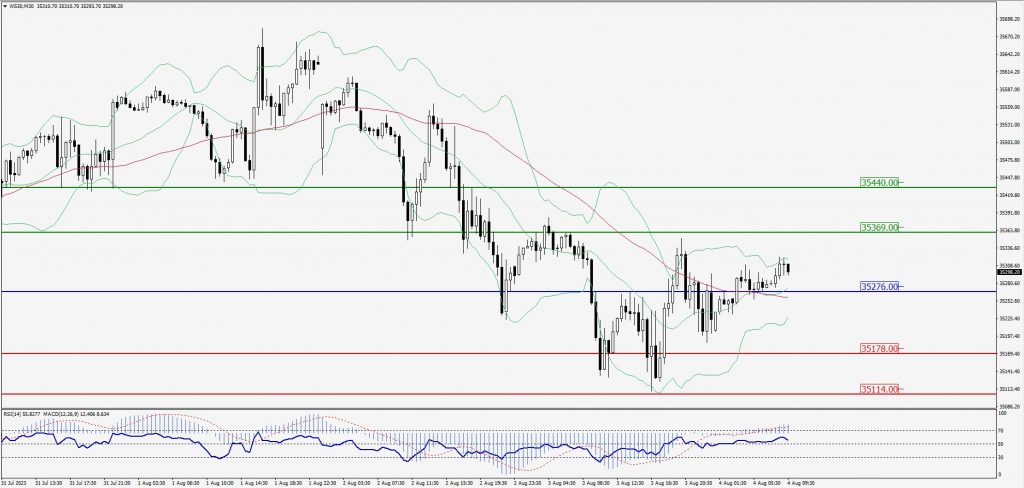
Dow Jones Intraday: Trend on the upside
Our pivot point is 35,276.00
Preferable Price Action: Take buy positions above the pivot with targets at 35,369.00 & 35,440.00.
Alternative Price Action: Below 35,276.00 looks for further downside to 35,178.00 & 35,114.00.
Comment: RSI is above 50 levels and Pairs above its 20MA & 55MA.
Green Lines Indicate Resistance Levels – Red Lines Indicate Support Levels
Light Blue is a Pivot Point – Black represents the price when the report was produced