Market Wrap: Stocks, Bonds, Commodities
US stock futures traded near the flatline on Monday as investors awaited a flood of corporate earnings reports.
The Dow Jones Industrial Average rose 100.24 points to 35,559.53, the S&P 500 gain 0.15% to 4,588.96 and the Nasdaq Composite add 29.37 points to 14,346.02.
MSCI’s index of Asia-Pacific stocks outside Japan is drop 0.21% to 665.03 levels. The Australian index was higher by 0.54% to 7,450.70. Japanese Nikkei Index ascend 0.79% today.
European stocks were negative on Tuesday, with the Stoxx Europe 50 Index fell 0.71% to 4,438.15, Germany’s DAX drop 0.73% to 16,329.45, and France’s CAC decline 0.72% to 7,441.78 and U.K.’s FTSE 100 subtract 0.21% to 7,683.42.
Benchmark 10-year U.S. Treasury fell as demand for safe assets ascend again, today 10-year bond yields positive 0.40% to 3.9740.
Oil prices rallied to a fresh three-month high on Monday and recorded their steepest monthly gains since January 2022, supported by signs of tightening global supply and rising demand through the rest of this year.
Spot Brent crude oil drop 0.34% to $85.14 per barrel. US West Texas Intermediate crude is down 0.44% to $81.44 a barrel.
The yellow metal gold is decline 0.73% to 1,994.45 dollars per ounce.
Market Wrap: Forex
The U.S. dollar edged higher in early European trade Tuesday, while sterling fell as U.K. house prices slumped sharply as rising interest rates weighed.
Today, the U.S. dollar index measures the Greenback against a trade-weighted basket of six major currencies, which surged 0.31% to 101.940.
The Euro US Dollar (EUR/USD) is a widely traded pair that is down 0.21% today. This left the pair trading around $1.09700.
The Japanese yen was negative against the U.S. dollar on Tuesday. Today USD/JPY is surged 0.33% to the 142.750 level.
Another commodity-related currency negative against the U.S dollar, AUD/USD fell 1.26% to 0.66360, and NZD/USD slipped 0.75% to 0.61610 level.
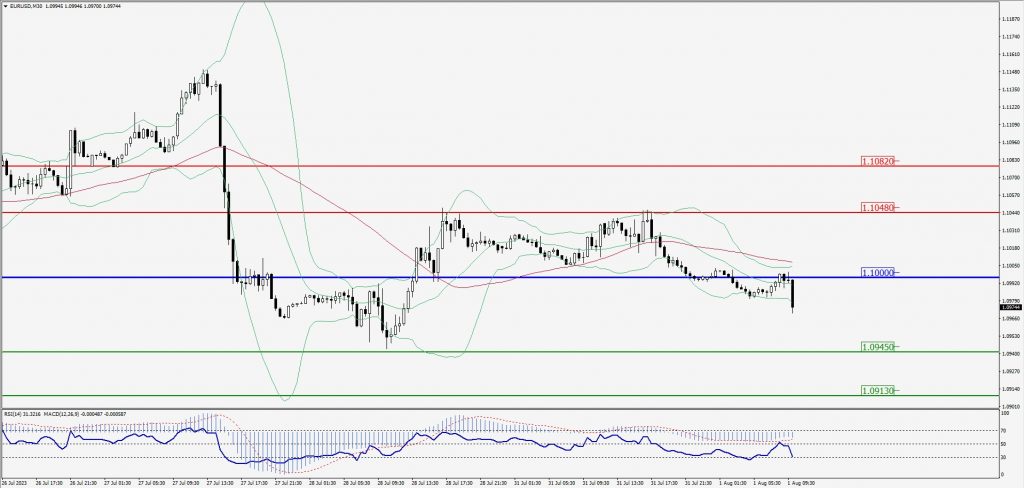
EUR/USD Intraday: Reisitance level at 1.10000
Our pivot point is at 1.10000
Preferable Price Action: Take sell positions below pivot level with targets at 1.09450 & 1.09130 in extension.
Alternative Price Action: Above pivot looks for a further upside to 1.10480 & 1.10820.
Comment: RSI is below 50 levels and Pairs below its 20MA & 55MA.
Green Lines Indicate Resistance Levels – Red Lines Indicate Support Levels
Light Blue is a Pivot Point – Black represents the price when the report was produced
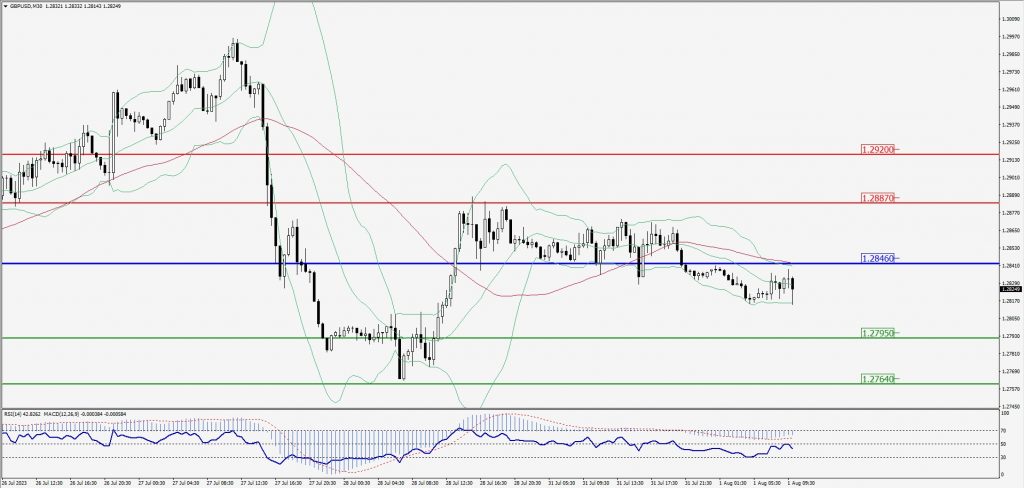
GBP/USD Intraday: Trend on the downside
Our pivot point is at 1.28460
Preferable Price Action: Sell positions below pivot with targets at 1.27950 & 1.27640 in extension.
Alternative Price Action: The price above pivot would call for further upside to 1.28870 & 1.29200.
Comment: RSI is below 50 levels and Pairs below 55MA.
Green Lines Indicate Resistance Levels – Red Lines Indicate Support Levels
Light Blue is a Pivot Point – Black represents the price when the report was produced
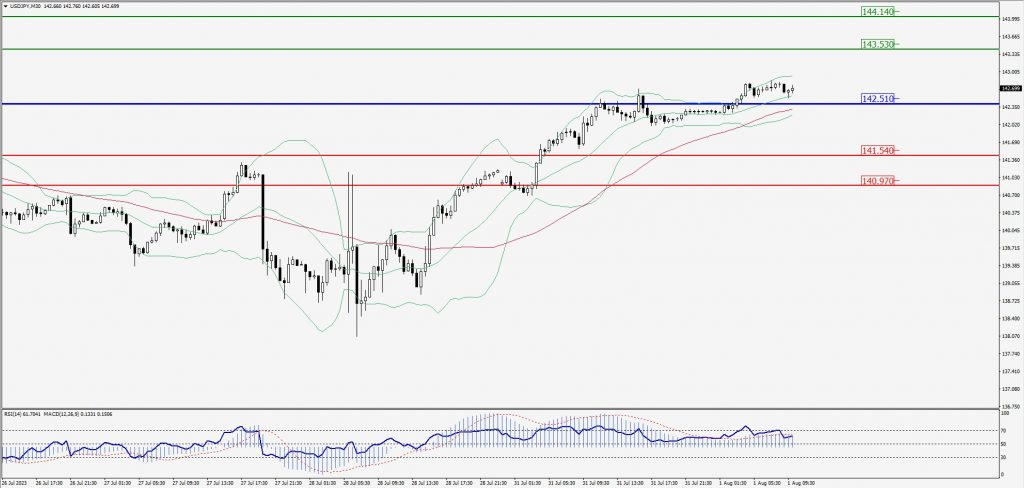
USD/JPY Intraday: Trend on the upside
Our pivot point is at 142.510
Preferable Price Action: Buy position above pivot with the target at 143.530 and 144.140 in extension.
Alternative Price Action: The downside breakout of the pivot would call for 141.540 and 140.970.
Comment: MACD is above 50 level and Pairs above its 20MA & 55MA.
Green Lines Indicate Resistance Levels – Red Lines Indicate Support Levels
Light Blue is a Pivot Point – Black represents the price when the report was produced
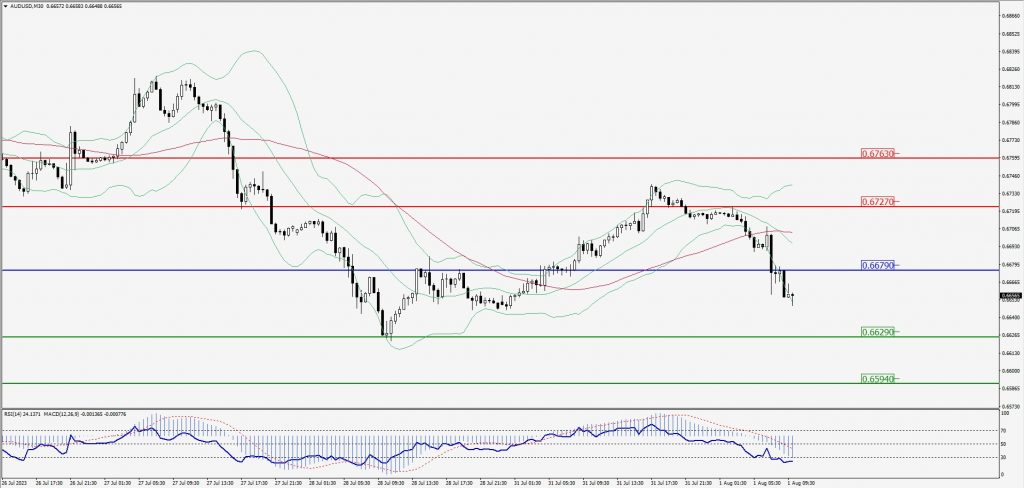
AUD/USD Intraday: Major trend on the downside
Our pivot point is at 0.66790
Preferable Price Action: Sell positions below pivot with targets at 0.66290 & 0.65940 in extension.
Alternative Price Action: Above pivot looks for a further upside with 0.67270 & 0.67630 as targets.
Comment: RSI is below 50 levels and Pairs below its 20AM & 55MA.
Green Lines Indicate Resistance Levels – Red Lines Indicate Support Levels
Light Blue is a Pivot Point – Black represents the price when the report was produced
CRUDEOIL Intraday: Resistance level at 81.44
Our pivot point is at 81.44
Preferable Price Action: Below pivot sell oil with 80.83 & 80.44 as targets.
Alternative Price Action: Buy crude above pivot with targets at 81.97 and 82.36 in extension.
Comment: MACD is negative territory and Pairs below 20MA.
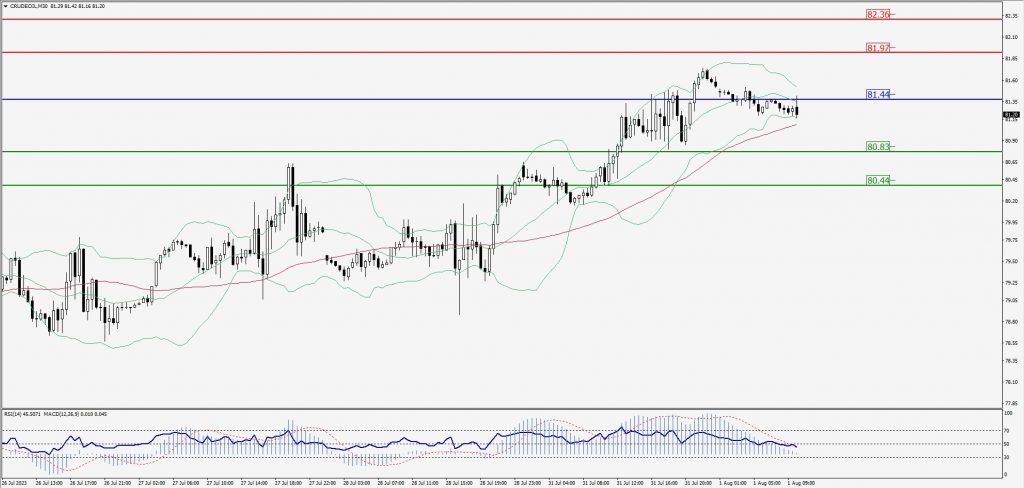
Green Lines Indicate Resistance Levels – Red Lines Indicate Support Levels
Light Blue is a Pivot Point – Black represents the price when the report was produced
XAU/USD Intraday: Trend on the downside
Our pivot point is 1960.30
Preferable Price Action: Further downside to 1950.70 and 1945.10.
Alternative Price Action: If the price gives an upside breakout of a pivot, then the price extends to 1967.70 and 1973.10.
Comment: MACD is below 50 level and Pairs below its 20MA & 55MA.
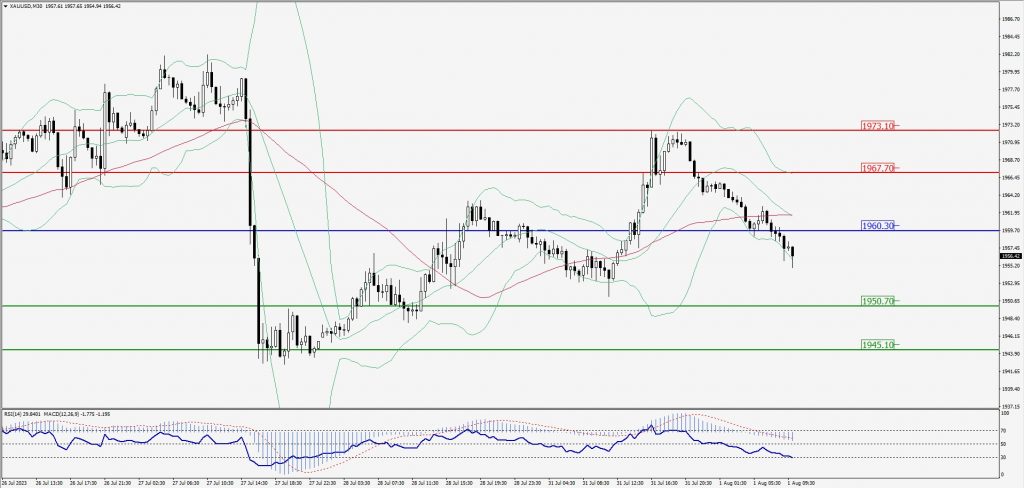
Green Lines Indicate Resistance Levels – Red Lines Indicate Support Levels
Light Blue is a Pivot Point – Black represents the price when the report was produced
Dow Jones Intraday: Trend on the downside
Our pivot point is 35,576.00
Preferable Price Action: Take sell positions below the pivot with targets at 35,460.00 & 35,399.00.
Alternative Price Action: Above 35,576.00 looks for further upside to 35,666.00 & 35,724.00.
Comment: RSI is below 50 levels and Pairs below 20MA.
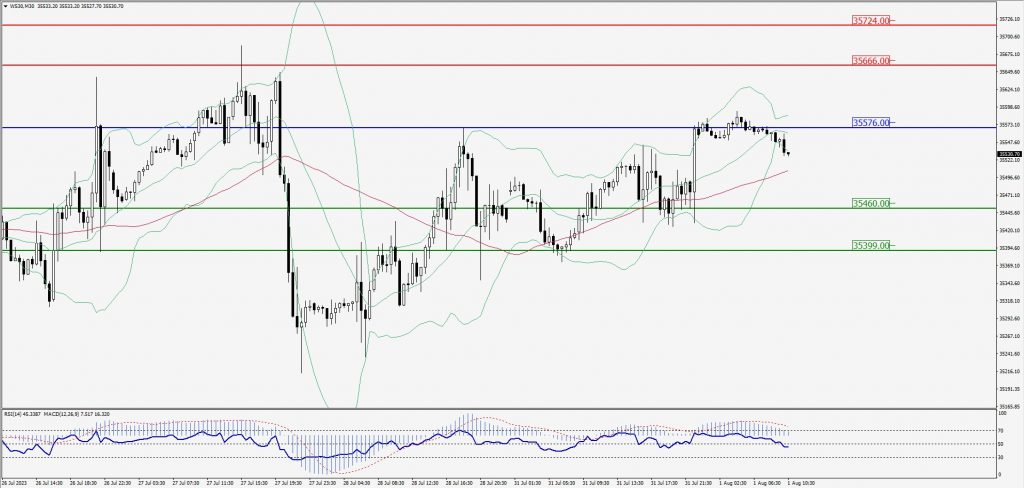
Green Lines Indicate Resistance Levels – Red Lines Indicate Support Levels
Light Blue is a Pivot Point – Black represents the price when the report was produced