Market Wrap: Stocks, Bonds, Commodities
Stock futures were near flat on Thursday night as Wall Street awaited new inflation data due Friday morning. Futures tied to the Dow Jones Industrial Average were little changed.
The Dow Jones Industrial Average fell 237.40 points to 35,282.72, the S&P 500 lose 0.64% to 4,537.41 and the Nasdaq Composite subtract 77.18 points to 14,050.11.
MSCI’s index of Asia-Pacific stocks outside Japan is ascend 0.50% to 661.03 levels. The Australian index was lower by 0.70% to 7,403.60. Japanese Nikkei Index drop 0.47% today.
European stocks were mixed on Friday, with the Stoxx Europe 50 Index fell 0.38% to 4,430.95, Germany’s DAX decline 0.31% to 16,354.65, and France’s CAC drop 0.49% to 7,429.33 and U.K.’s FTSE 100 add 0.28% to 7,712.78.
Benchmark 10-year U.S. Treasury fell as demand for safe assets ascend again, today 10-year bond yields negative 0.25% to 4.0040.
Oil climbed on Thursday, with Brent crude topping $84 a barrel for the first time since April, supported by supply tightness following OPEC+ production cuts and renewed bullishness on the outlook for Chinese demand and global growth.
Spot Brent crude oil ascend 0.37% to $83.50 per barrel. US West Texas Intermediate crude is down 0.26% to $79.88 a barrel.
The yellow metal gold is advance 0.13% to 1,948.10 dollars per ounce.
Market Wrap: Forex
The U.S. dollar edged higher in early European trade Friday, adding to the previous session’s strong gains, while the Japanese yen gained after the Bank of Japan shifted its monetary policy.
Today, the U.S. dollar index measures the Greenback against a trade-weighted basket of six major currencies, which surged 0.09% to 101.640.
The Euro US Dollar (EUR/USD) is a widely traded pair that is down 0.08% today. This left the pair trading around $1.09640.
The Japanese yen was negative against the U.S. dollar on Friday. Today USD/JPY is slipped 0.20% to the 139.730 level.
Another commodity-related currency negative against the U.S dollar, AUD/USD fell 0.97% to 0.66410, and NZD/USD slipped 0.82% to 0.61330 level.
EUR/USD Intraday: Trend on the downside
Our pivot point is at 1.10020
Preferable Price Action: Take sell positions above pivot level with targets at 1.09510 & 1.09220 in extension.
Alternative Price Action: Above pivot looks for a further upside to 1.10470 & 1.10810.
Comment: RSI is below 50 levels and Pairs below its 20MA & 55MA.
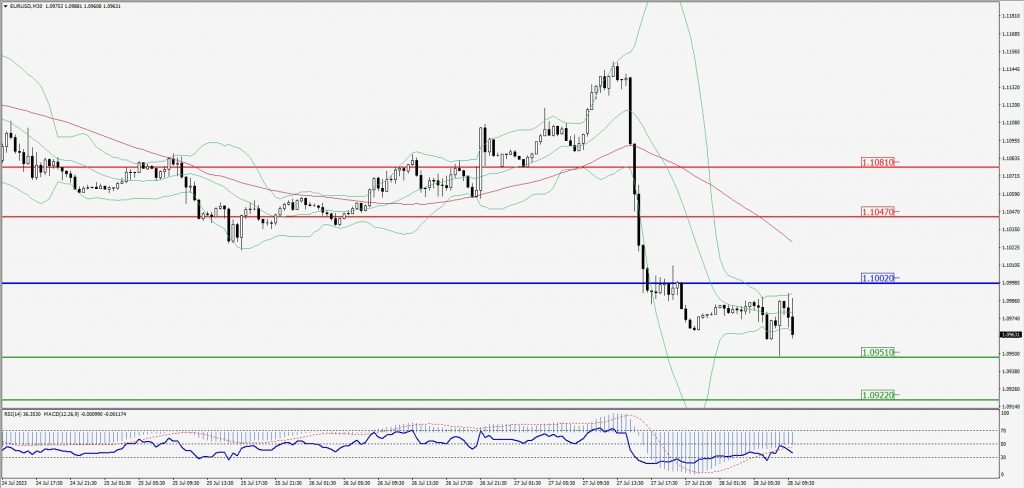
Green Lines Indicate Resistance Levels – Red Lines Indicate Support Levels
Light Blue is a Pivot Point – Black represents the price when the report was produced
GBP/USD Intraday: Trend on the downside
Our pivot point is at 1.28210
Preferable Price Action: Sell positions below pivot with targets at 1.27450 & 1.27000 in extension.
Alternative Price Action: The price above pivot would call for further upside to 1.28840 & 1.29360.
Comment: RSI is below 50 levels and Pairs below 55MA.
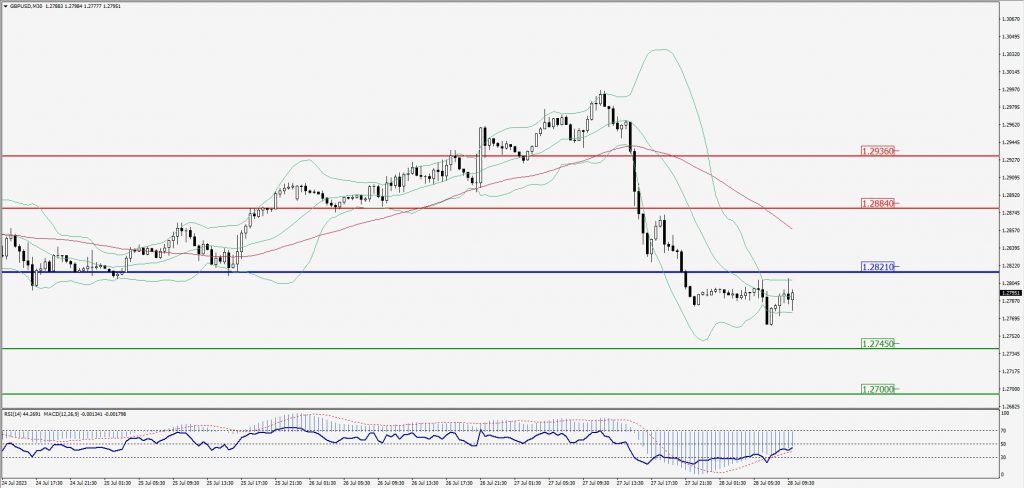
Green Lines Indicate Resistance Levels – Red Lines Indicate Support Levels
Light Blue is a Pivot Point – Black represents the price when the report was produced
USD/JPY Intraday: Resistance level at 139.490
Our pivot point is at 139.490
Preferable Price Action: Sell position below pivot with the target at 138.560 and 138.030 in extension.
Alternative Price Action: The upside breakout of the pivot would call for 140.270 and 140.880.
Comment: MACD is below 50 level and Pairs below 55MA.
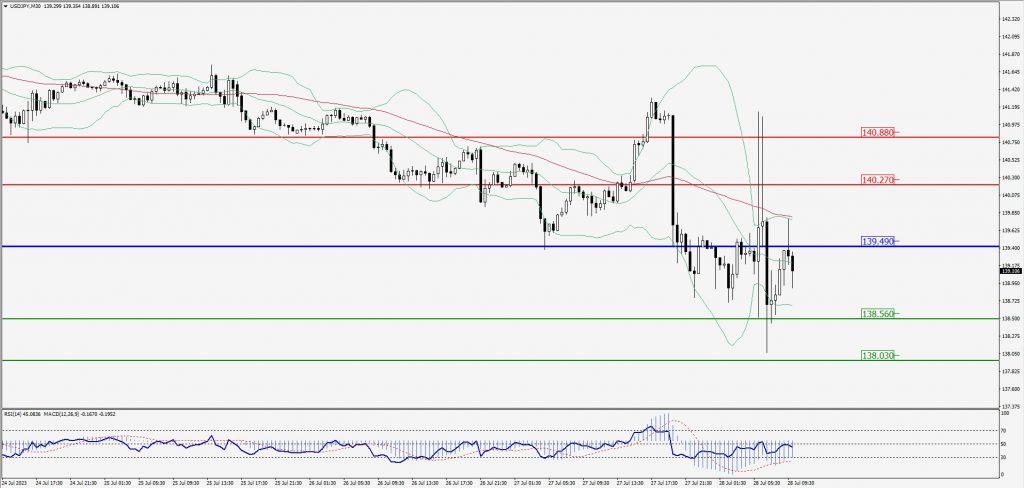
Green Lines Indicate Resistance Levels – Red Lines Indicate Support Levels
Light Blue is a Pivot Point – Black represents the price when the report was produced
AUD/USD Intraday: Major trend on the downside
Our pivot point is at 0.66630
Preferable Price Action: Sell positions below pivot with targets at 0.66150 & 0.65860 in extension.
Alternative Price Action: Above pivot looks for a further upside with 0.67010 & 0.67330 as targets.
Comment: RSI is below 50 levels and Pairs below its 20AM & 55MA.
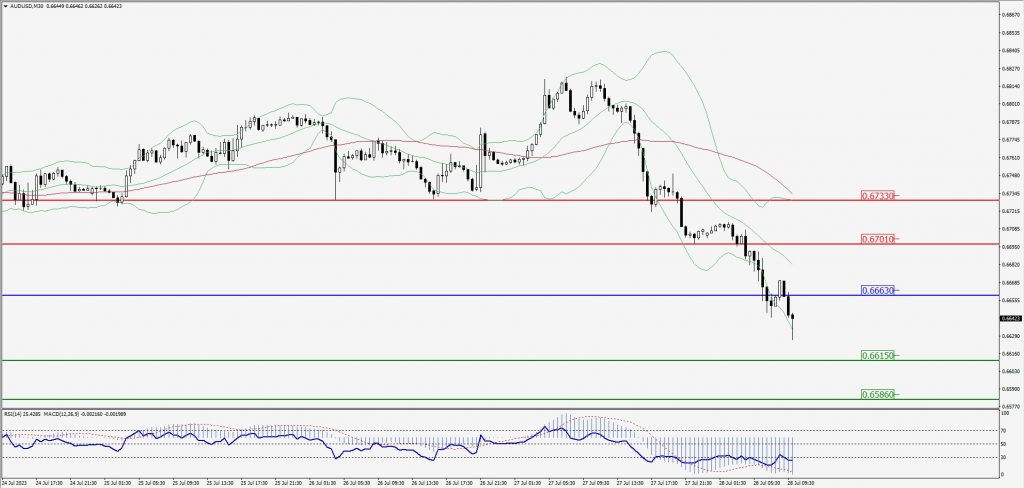
Green Lines Indicate Resistance Levels – Red Lines Indicate Support Levels
Light Blue is a Pivot Point – Black represents the price when the report was produced
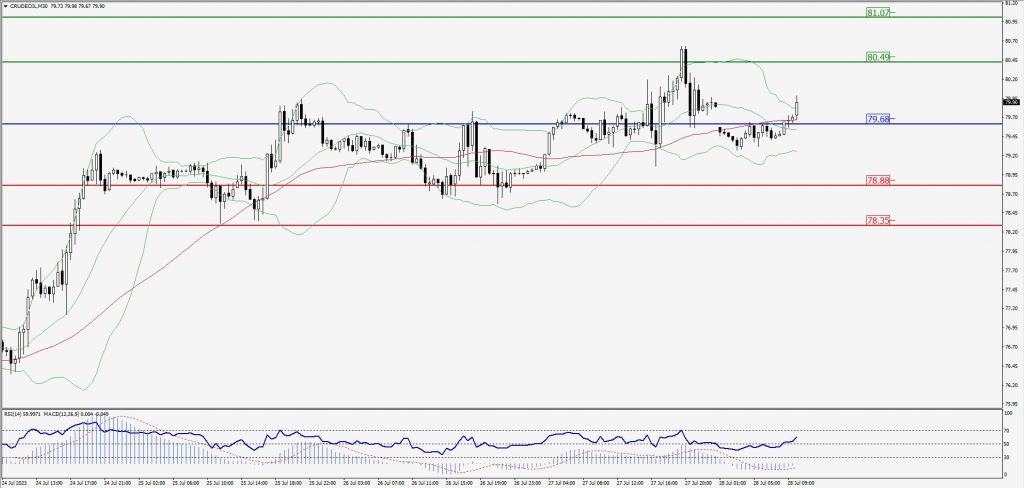
CRUDEOIL Intraday: Support level at 79.68
Our pivot point is at 79.68
Preferable Price Action: Above pivot buy oil with 80.49 & 81.07 as targets.
Alternative Price Action:Sell crude below pivot with targets at 78.88 and 78.35 in extension.
Comment: MACD is positive territory and Pairs above 20MA.
Green Lines Indicate Resistance Levels – Red Lines Indicate Support Levels
Light Blue is a Pivot Point – Black represents the price when the report was produced
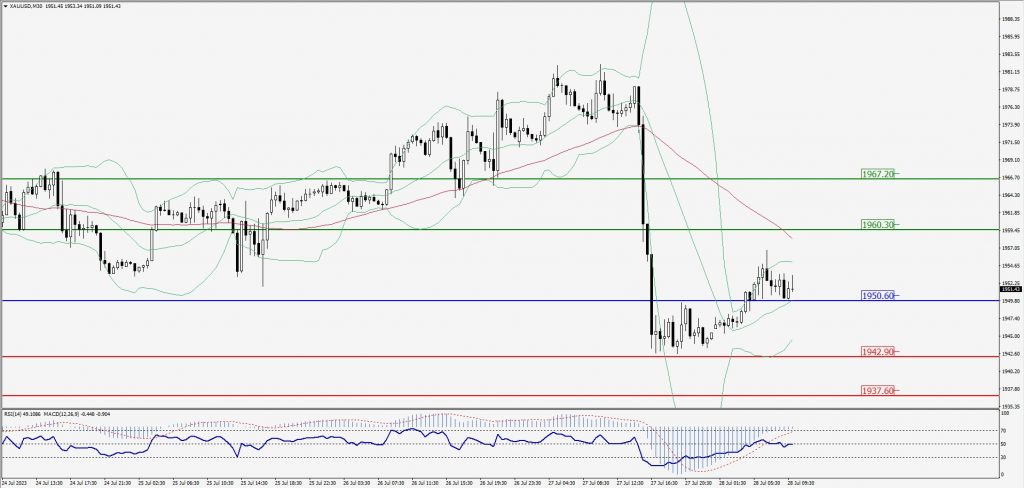
XAU/USD Intraday: In a consolidation zone
Our pivot point is 1950.60
Preferable Price Action: Further upside to 1960.30 and 1967.20.
Alternative Price Action: If the price gives a downside breakout of a pivot, then the price extends to 1942.90 and 1937.60.
Comment: MACD is at 50 level and Pairs above 20MA.
Green Lines Indicate Resistance Levels – Red Lines Indicate Support Levels
Light Blue is a Pivot Point – Black represents the price when the report was produced
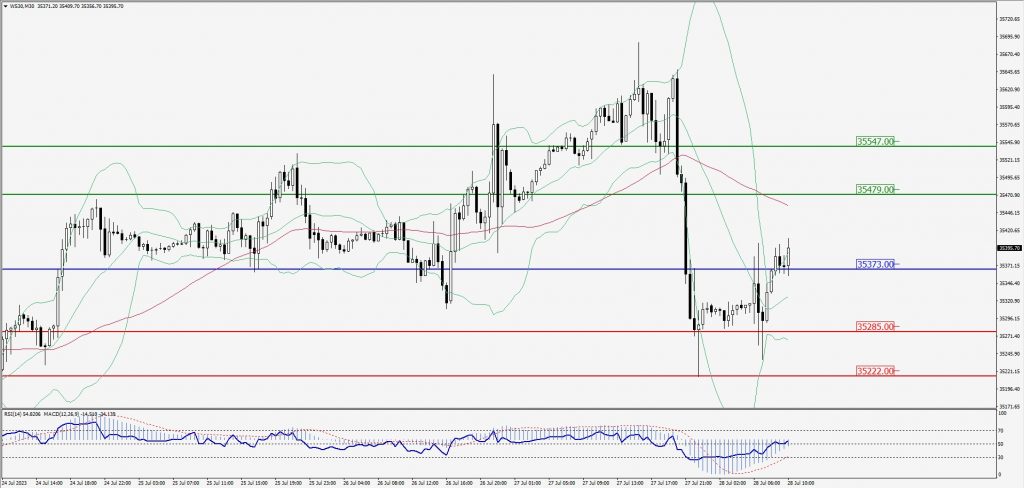
Dow Jones Intraday: Trend on the upside
Our pivot point is 35,373.00
Preferable Price Action: Take buy positions above the pivot with targets at 35,479.00 & 35,547.00.
Alternative Price Action: Below 35,373.00 looks for further downside to 35,285.00 & 35,222.00.
Comment: RSI is above 50 levels and Pairs above 20MA.
Green Lines Indicate Resistance Levels – Red Lines Indicate Support Levels
Light Blue is a Pivot Point – Black represents the price when the report was produced