Market Wrap: Stocks, Bonds, Commodities
S&P 500 futures were little changed Sunday evening as investors awaited a batch of key earnings reports and a major policy decision from the Federal Reserve.
The Dow Jones Industrial Average rose 2.51 points to 35,227.69, the S&P 500 gain 0.03% to 4,536.34 and the Nasdaq Composite subtract 30.50 points to 14,032.80.
MSCI’s index of Asia-Pacific stocks outside Japan is decline 0.62% to 640.11 levels. The Australian index was lower by 0.10% to 7,306.40. Japanese Nikkei Index ascend 1.17% today.
European stocks were mixed on Monday, with the Stoxx Europe 50 Index fell 0.19% to 4,383.05, Germany’s DAX advance 0.17% to 16,206.05, and France’s CAC drop 0.13% to 7,422.72 and U.K.’s FTSE 100 add 0.09% to 7,670.06.
Benchmark 10-year U.S. Treasury fell as demand for safe assets ascend again, today 10-year bond yields negative 0.57% to 3.8170.
Oil prices rose more than a dollar per barrel on Friday, buoyed by growing evidence of supply shortages in the coming months and rising tensions between Russia and Ukraine that could further hit supplies.
Spot Brent crude oil ascend 0.31% to $81.14 per barrel. US West Texas Intermediate crude is up 0.42% to $77.41 a barrel.
The yellow metal gold is advance 0.01% to 1,966.70 dollars per ounce.
Market Wrap: Forex
The U.S. dollar edged lower in early European hours Monday, but losses are minimal as traders await signals from a string of central bank meetings this week, with the Federal Reserve, in particular, in the spotlight.
Today, the U.S. dollar index measures the Greenback against a trade-weighted basket of six major currencies, which surged 0.17% to 100.970.
The Euro US Dollar (EUR/USD) is a widely traded pair that is down 0.32% today. This left the pair trading around $1.10860.
The Japanese yen was negative against the U.S. dollar on Monday. Today USD/JPY is slipped 0.29% to the 141.370 level.
Another commodity-related currency positive against the U.S dollar, AUD/USD rose 0.30% to 0.67470, and NZD/USD surged 0.62% to 0.62050 level.
EUR/USD Intraday: Support level at 1.11230
Our pivot point is at 1.11230
Preferable Price Action: Take buy positions above pivot level with targets at 1.11670 & 1.11960 in extension.
Alternative Price Action: Below pivot looks for a further downside to 1.10860 & 1.10610.
Comment: RSI is above 50 levels and Pairs above its 20MA & 55MA.
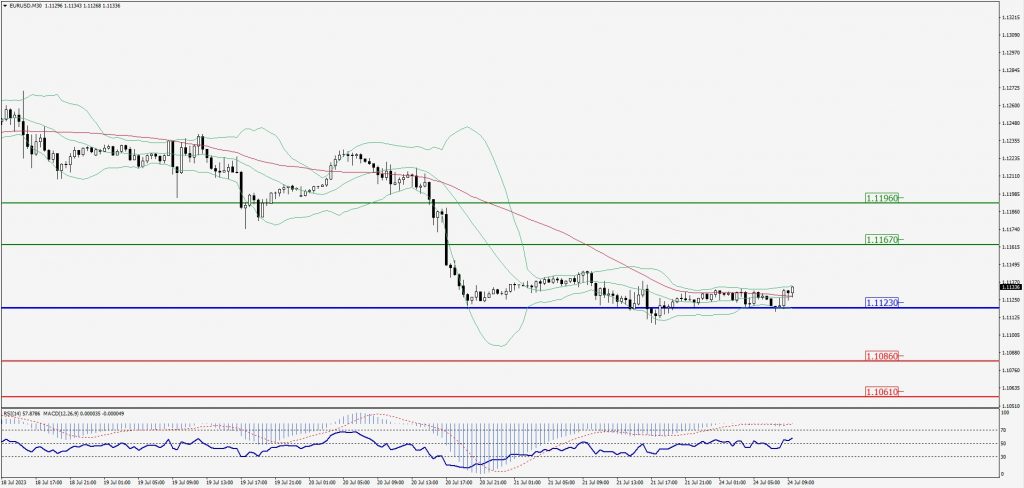
Green Lines Indicate Resistance Levels – Red Lines Indicate Support Levels
Light Blue is a Pivot Point – Black represents the price when the report was produced
GBP/USD Intraday: Trend on the upside
Our pivot point is at 1.28570
Preferable Price Action: Buy positions above pivot with targets at 1.29220 & 1.29710 in extension.
Alternative Price Action: The price below pivot would call for further downside to 1.28000 & 1.27590.
Comment: RSI is above 50 levels and Pairs above its 20MA & 55MA.
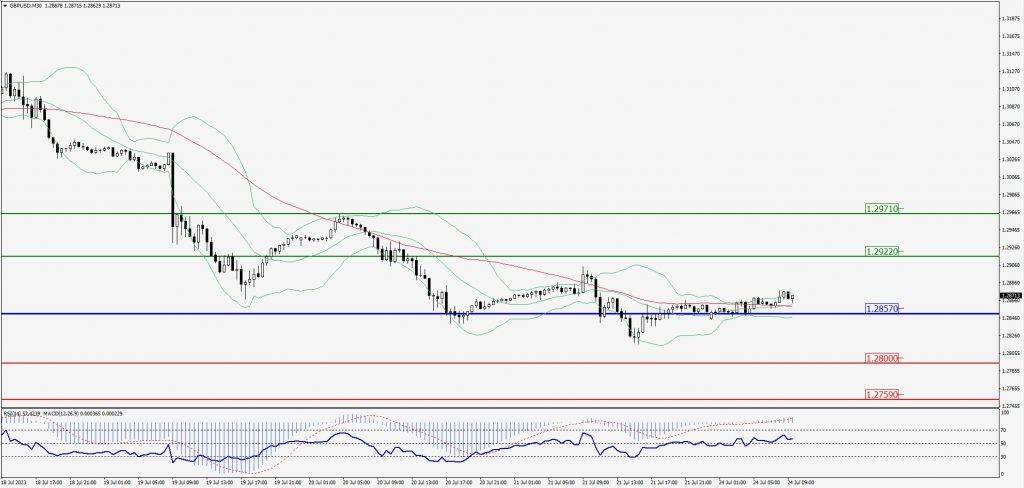
Green Lines Indicate Resistance Levels – Red Lines Indicate Support Levels
Light Blue is a Pivot Point – Black represents the price when the report was produced
USD/JPY Intraday: Trend on the downside
Our pivot point is at 141.810
Preferable Price Action: Sell position below pivot with the target at 140.910 and 140.390 in extension.
Alternative Price Action: The upside breakout of the pivot would call for 142.580 and 143.120.
Comment: MACD is below 50 level and Pairs below 20MA.
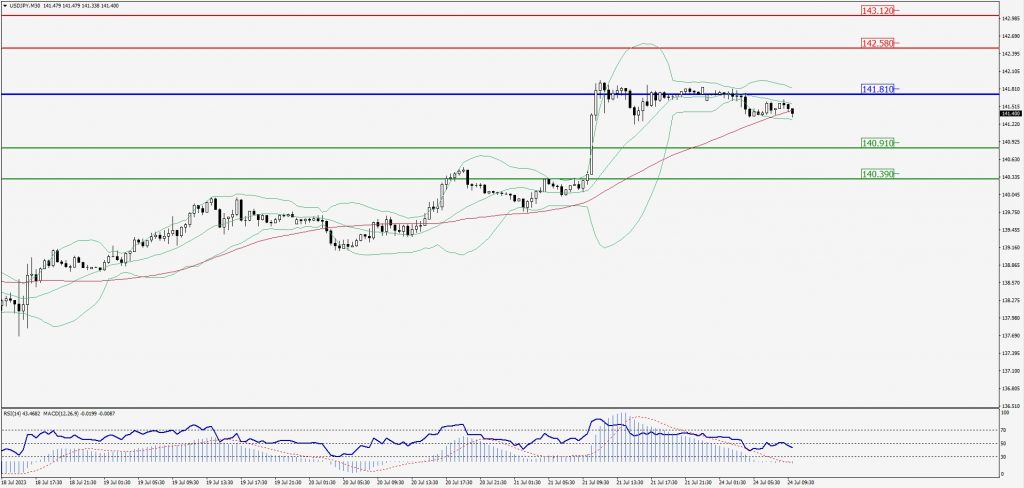
Green Lines Indicate Resistance Levels – Red Lines Indicate Support Levels
Light Blue is a Pivot Point – Black represents the price when the report was produced
AUD/USD Intraday: Trend on the upside
Our pivot point is at 0.67300
Preferable Price Action: Buy positions above pivot with targets at 0.67560 & 0.67760 in extension.
Alternative Price Action: Below pivot looks for a further downside with 0.67060 & 0.66880 as targets.
Comment: RSI is above 50 levels and Pairs above 20MA.
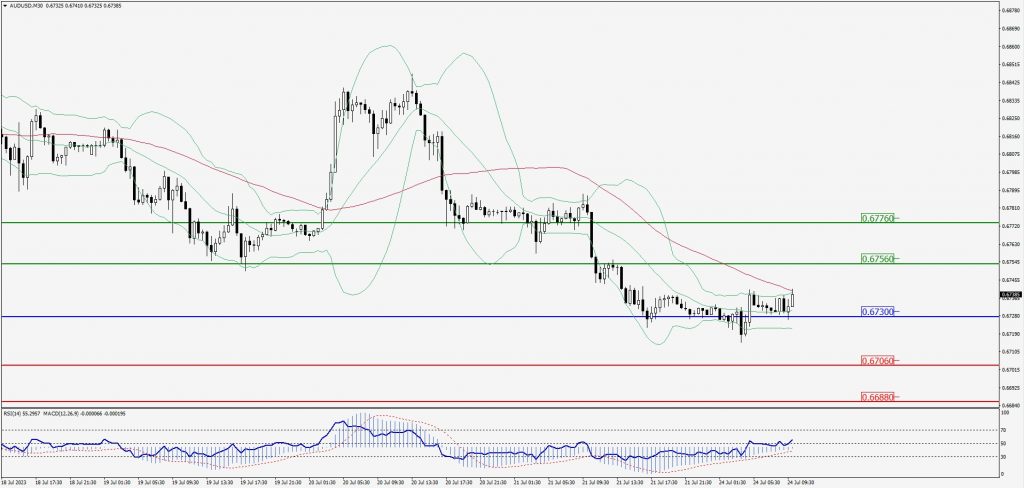
Green Lines Indicate Resistance Levels – Red Lines Indicate Support Levels
Light Blue is a Pivot Point – Black represents the price when the report was produced
CRUDEOIL Intraday: Trend on the downside
Our pivot point is at 76.80
Preferable Price Action: Below pivot sell oil with 76.08 & 75.70 as targets.
Alternative Price Action:Buy crude above pivot with targets at 77.42 and 77.84 in extension.
Comment: MACD is negative territory and Pairs below 20MA.
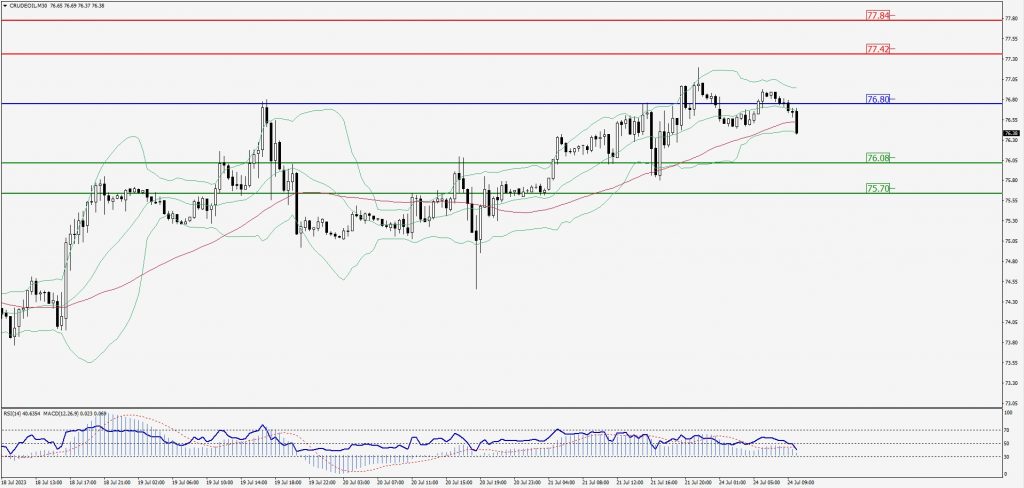
Green Lines Indicate Resistance Levels – Red Lines Indicate Support Levels
Light Blue is a Pivot Point – Black represents the price when the report was produced
XAU/USD Intraday: Trend on the upside
Our pivot point is 1962.30
Preferable Price Action: Further upside to 1967.10 and 1970.20.
Alternative Price Action: If the price gives a downside breakout of a pivot, then the price extends to 1958.20 and 1955.10.
Comment: MACD is above 50 level and Pairs above 20MA.
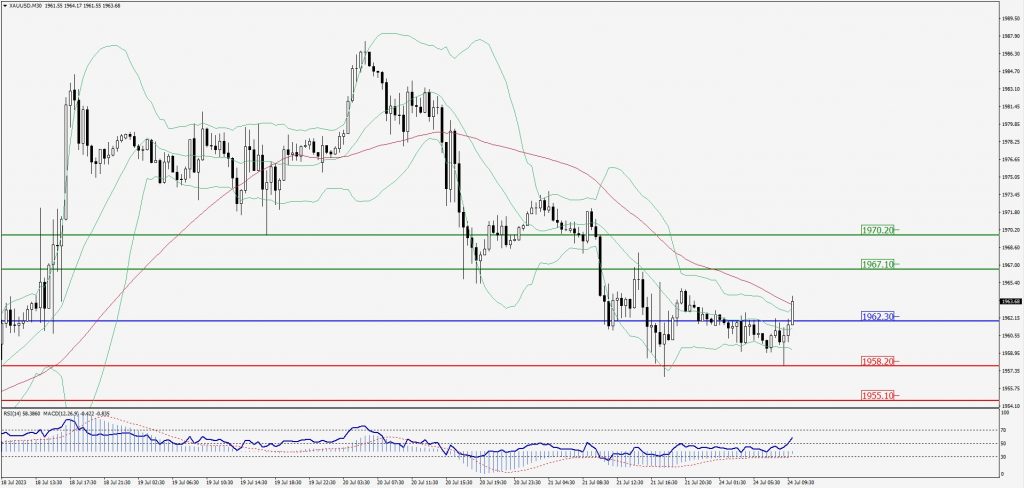
Green Lines Indicate Resistance Levels – Red Lines Indicate Support Levels
Light Blue is a Pivot Point – Black represents the price when the report was produced
Dow Jones Intraday: Trend on the upside
Our pivot point is 35,200.00
Preferable Price Action: Take buy positions above the pivot with targets at 35,424.00 & 35,582.00.
Alternative Price Action: Below 35,200.00 looks for further downside to 35,018.00 & 34,876.00.
Comment: RSI is above 50 levels and Pairs above 20MA.
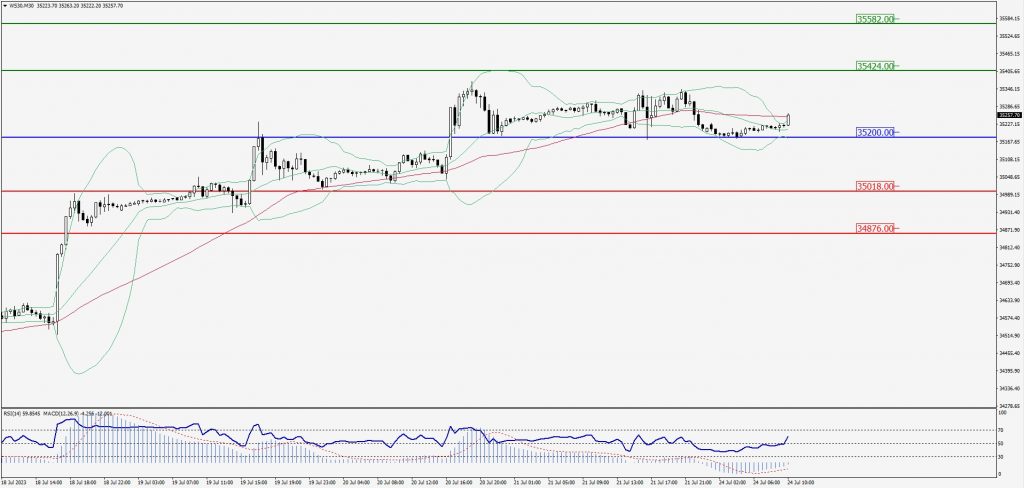
Green Lines Indicate Resistance Levels – Red Lines Indicate Support Levels
Light Blue is a Pivot Point – Black represents the price when the report was produced