Market Wrap: Stocks, Bonds, Commodities
Australia’s Zip Co Ltd said on Thursday it faced a jump in bad debts at home grounds, its biggest market by revenue, during the March-June quarter due to poor domestic consumer credit and discrepancies with third-party payment processors.
The Dow Jones Industrial Average rose 109.28 points to 35,061.21, the S&P 500 gain 0.24% to 4,565.72 and the Nasdaq Composite add 4.38 points to 14,358.02.
MSCI’s index of Asia-Pacific stocks outside Japan is decline 0.24% to 646.46 levels. The Australian index was higher by 0.02% to 7,325.00. Japanese Nikkei Index decline 1.31% today.
European stocks were mixed on Thursday, with the Stoxx Europe 50 Index fell 0.08% to 4,358.85, Germany’s DAX advance 0.14% to 16,131.25, and France’s CAC ascend 0.25% to 7,344.79 and U.K.’s FTSE 100 add 0.62% to 7,634.96.
Benchmark 10-year U.S. Treasury fell as demand for safe assets ascend again, today 10-year bond yields positive 1.15% to 3.7870.
Oil prices were little changed on Thursday as a lower-than-expected drop in U.S. crude inventories and a potentially weaker demand outlook kept investors cautious.
Spot Brent crude oil ascend 0.15% to $79.58 per barrel. US West Texas Intermediate crude is up 0.20% to $75.44 a barrel.
The yellow metal gold is advance 0.13% to 1,983.45 dollars per ounce.
Market Wrap: Forex
The U.S. dollar edged lower in early European hours Thursday as its rebound stalled, while the Australian dollar bounced on strong employment data and sterling remained weak.
Today, the U.S. dollar index measures the Greenback against a trade-weighted basket of six major currencies, which slipped 0.08% to 99.900.
The Euro US Dollar (EUR/USD) is a widely traded pair that is up 0.13% today. This left the pair trading around $1.12120.
The Japanese yen was negative against the U.S. dollar on Thursday. Today USD/JPY is slipped 0.16% to the 139.420 level.
Another commodity-related currency positive against the U.S dollar, AUD/USD rose 0.83% to 0.68310, and NZD/USD surged 0.40% to 0.62880 level.
EUR/USD Intraday: In a consolidation zone
Our pivot point is at 1.12200
Preferable Price Action: Take sell positions below pivot level with targets at 1.11940 & 1.11770 in extension.
Alternative Price Action: Above pivot looks for a further upside to 1.12410 & 1.12570.
Comment: RSI is at 50 levels.
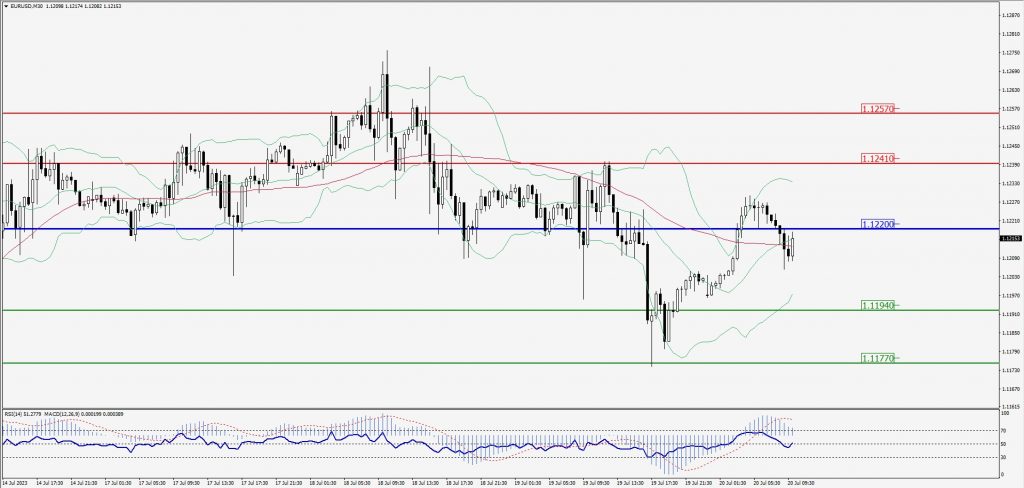
Green Lines Indicate Resistance Levels – Red Lines Indicate Support Levels
Light Blue is a Pivot Point – Black represents the price when the report was produced
GBP/USD Intraday: Major trend on the downside
Our pivot point is at 1.29460
Preferable Price Action: Sell positions below pivot with targets at 1.28710 & 1.28280 in extension.
Alternative Price Action: The price above pivot would call for further upside to 1.30090 & 1.30560.
Comment: RSI is below 50 levels and Pairs below its 20MA & 55MA.
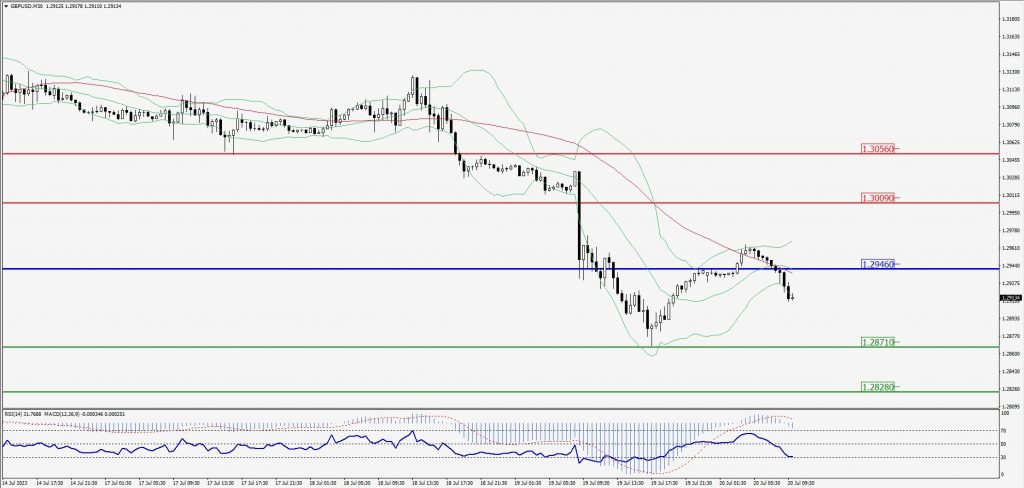
Green Lines Indicate Resistance Levels – Red Lines Indicate Support Levels
Light Blue is a Pivot Point – Black represents the price when the report was produced
USD/JPY Intraday: Resistance level at 139.690
Our pivot point is at 139.690
Preferable Price Action: Sell position below pivot with the target at 139.110 and 138.760 in extension.
Alternative Price Action: The upside breakout of the pivot would call for 140.220 and 140.550.
Comment: MACD is below 50 level and Pairs below 55MA.
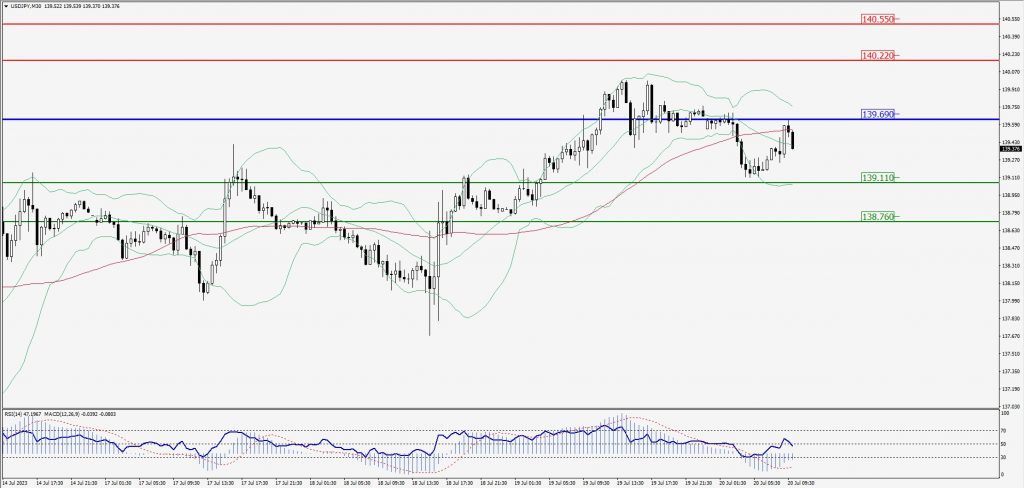
Green Lines Indicate Resistance Levels – Red Lines Indicate Support Levels
Light Blue is a Pivot Point – Black represents the price when the report was produced
AUD/USD Intraday: Trend on the upside
Our pivot point is at 0.68170
Preferable Price Action: Buy positions above pivot with targets at 0.68470 & 0.68690 in extension.
Alternative Price Action: Below pivot looks for a further downside with 0.67910 & 0.67720 as targets.
Comment: RSI is above 50 levels and Pairs above its 20MA & 55MA.
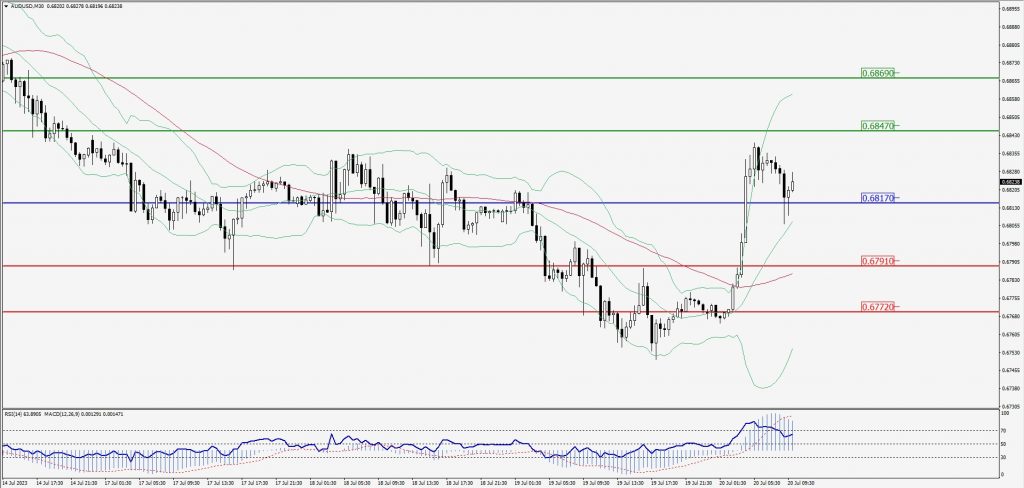
Green Lines Indicate Resistance Levels – Red Lines Indicate Support Levels
Light Blue is a Pivot Point – Black represents the price when the report was produced
CRUDEOIL Intraday: Trend on the downside
Our pivot point is at 75.49
Preferable Price Action: Below pivot sell oil with 74.86 & 74.44 as targets.
Alternative Price Action:Buy crude above pivot with targets at 76.06 and 76.49 in extension.
Comment: MACD is negative territory and Pairs below 55MA.
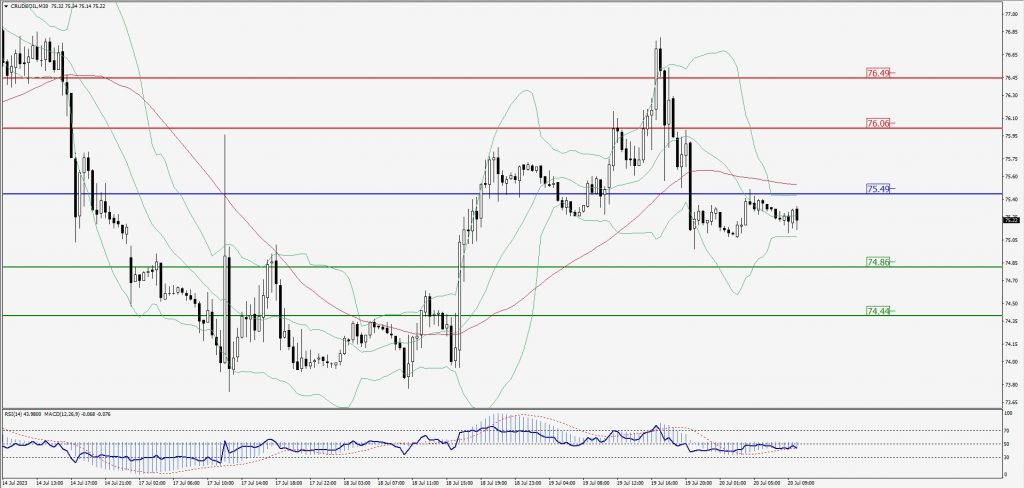
Green Lines Indicate Resistance Levels – Red Lines Indicate Support Levels
Light Blue is a Pivot Point – Black represents the price when the report was produced
XAU/USD Intraday: Trend on the upside
Our pivot point is 1979.20
Preferable Price Action: Further upside to 1988.40 and 1994.30.
Alternative Price Action: If the price gives a downside breakout of a pivot, then the price extends to 1971.60 and 1966.50.
Comment: MACD is above 50 level and Pairs above 55MA.
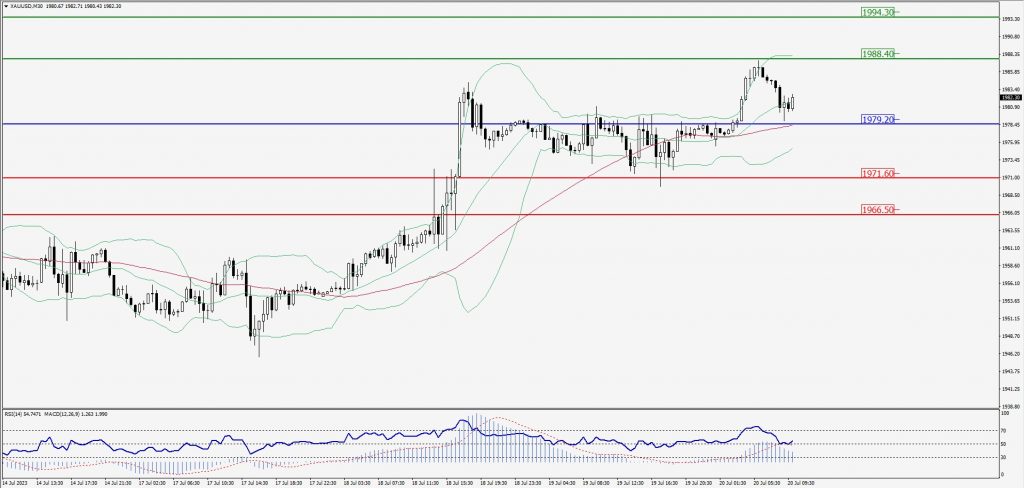
Green Lines Indicate Resistance Levels – Red Lines Indicate Support Levels
Light Blue is a Pivot Point – Black represents the price when the report was produced
Dow Jones Intraday: In a consolidation zone
Our pivot point is 35,121.00
Preferable Price Action: Take sell positions below the pivot with targets at 34,979.00 & 34,890.00.
Alternative Price Action: Above 35,121.00 looks for further upside to 35,248.00 & 35,335.00.
Comment: RSI is at 50 levels and Pairs below 20MA.
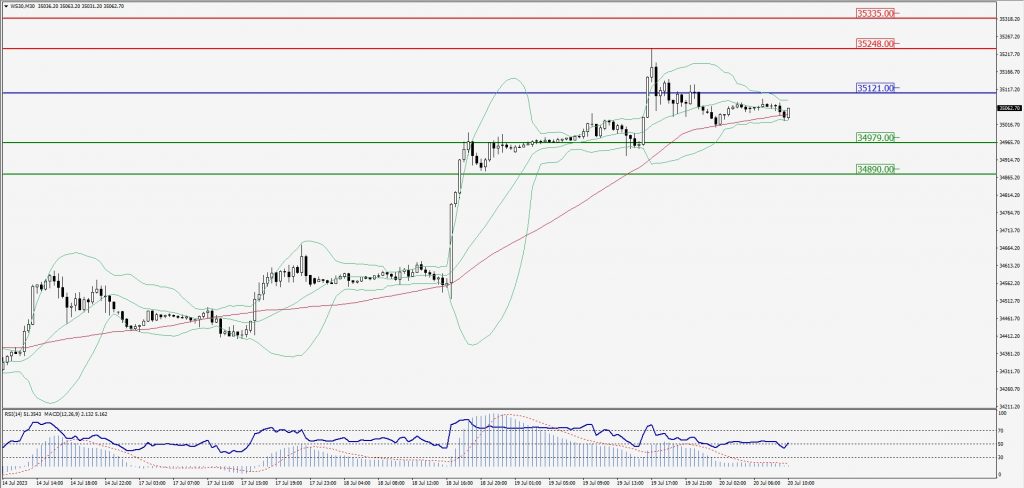
Green Lines Indicate Resistance Levels – Red Lines Indicate Support Levels
Light Blue is a Pivot Point – Black represents the price when the report was produced