Market Wrap: Stocks, Bonds, Commodities
US stocks gained on Tuesday, helped by optimism ahead of key inflation reports and as JPMorgan and other financial shares gained before earnings later this week.
The Dow Jones Industrial Average rose 317.02 points to 34,261.42, the S&P 500 gain 0.67% to 4,439.26 and the Nasdaq Composite add 75.22 points to 13,760.70.
MSCI’s index of Asia-Pacific stocks outside Japan is advance 0.68% to 637.28 levels. The Australian index was higher by 0.38% to 7,135.70. Japanese Nikkei Index decline 0.81% today.
European stocks were positive on Wednesday, with the Stoxx Europe 50 Index rose 0.85% to 4,322.85, Germany’s DAX advance 0.75% to 15,910.35, and France’s CAC ascend 0.75% to 7,274.41 and U.K.’s FTSE 100 add 1.00% to 7,355.04.
Benchmark 10-year U.S. Treasury fell as demand for safe assets ascend again, today 10-year bond yields negative 0.98% to 3.9410.
Oil prices barely moved on Wednesday as markets weighed a possible build in U.S. crude stockpiles and economic concerns against planned supply cuts by the world’s biggest oil exporters and hopes for higher global demand.
Spot Brent crude oil ascend 0.40% to $79.72 per barrel. US West Texas Intermediate crude is up 0.45% to $75.17 a barrel.
The yellow metal gold is advance 0.15% to 1,940.05 dollars per ounce.
Market Wrap: Forex
The dollar sank to a two-month low against its major peers on Wednesday in the lead-up to a key US inflation reading, while sterling scaled a 15-month top on expectations the Bank of England (BoE) has further to go in raising rates.
Today, the U.S. dollar index measures the Greenback against a trade-weighted basket of six major currencies, which slipped 0.21% to 101.190.
The Euro US Dollar (EUR/USD) is a widely traded pair that is up 0.12% today. This left the pair trading around $1.10190.
The Japanese yen was negative against the U.S. dollar on Wednesday. Today USD/JPY is slipped 0.51% to the 139.660 level.
Another commodity-related currency positive against the U.S dollar, AUD/USD rose 0.02% to 0.66870, and NZD/USD surged 0.02% to 0.61970 level.
EUR/USD Intraday: Trend on the upside
Our pivot point is at 1.10170
Preferable Price Action: Take buy positions above pivot level with targets at 1.10630 & 1.10930 in extension.
Alternative Price Action: Below pivot looks for a further downside to 1.09790 & 1.09480.
Comment: RSI is above 50 levels and Pairs above 55MA.
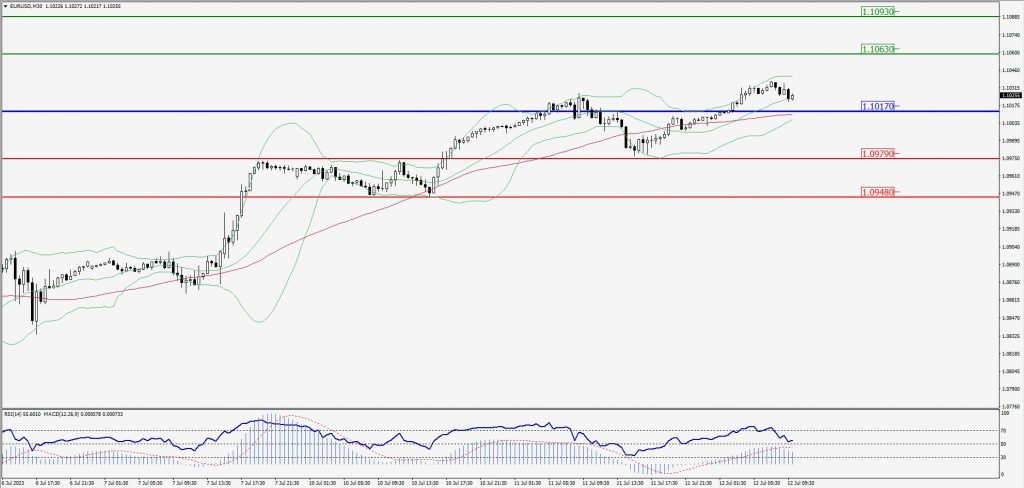
Green Lines Indicate Resistance Levels – Red Lines Indicate Support Levels
Light Blue is a Pivot Point – Black represents the price when the report was produced
GBP/USD Intraday: Trend on the upside
Our pivot point is at 1.29360
Preferable Price Action: Buy positions above pivot with targets at 1.30060 & 1.30440 in extension.
Alternative Price Action: The price below pivot would call for further downside to 1.28760 & 1.28380.
Comment: RSI is above 50 levels and Pairs above 55MA.
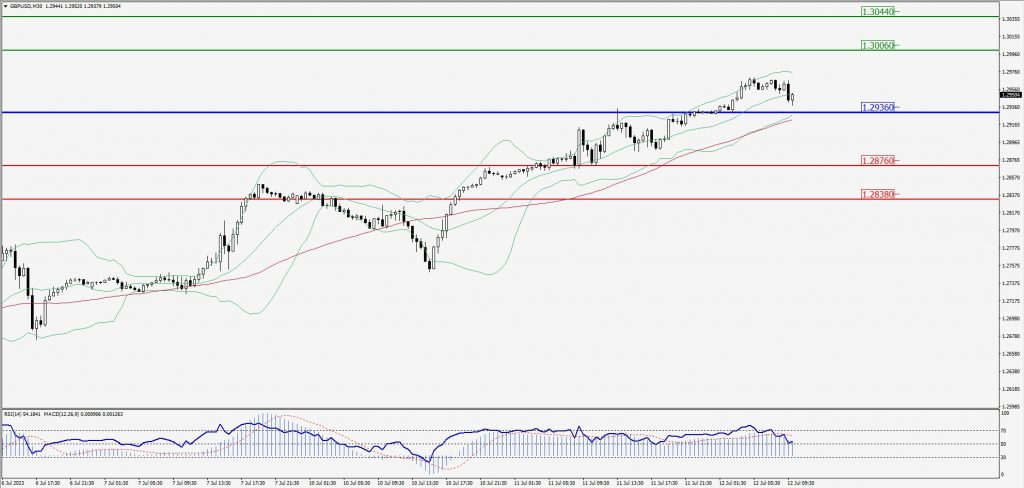
Green Lines Indicate Resistance Levels – Red Lines Indicate Support Levels
Light Blue is a Pivot Point – Black represents the price when the report was produced
USD/JPY Intraday: Trend on the downside
Our pivot point is at 140.190
Preferable Price Action: Sell position below pivot with the target at 138.950 and 138.110 in extension.
Alternative Price Action: The upside breakout of the pivot would call for 141.240 and 142.070.
Comment: MACD is below 50 level and Pairs below its 20MA & 55MA.
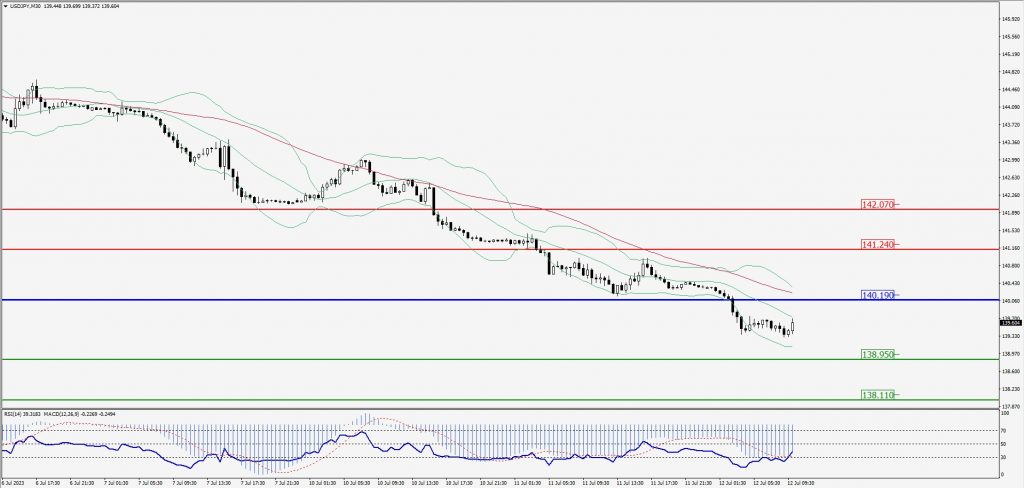
Green Lines Indicate Resistance Levels – Red Lines Indicate Support Levels
Light Blue is a Pivot Point – Black represents the price when the report was produced
AUD/USD Intraday: Trend on the downside
Our pivot point is at 0.67080
Preferable Price Action: Sell positions below pivot with targets at 0.66770 & 0.66580 in extension.
Alternative Price Action: Above pivot looks for a further upside with 0.67350 & 0.67560 as targets.
Comment: RSI is below 50 levels and Pairs below 20MA.
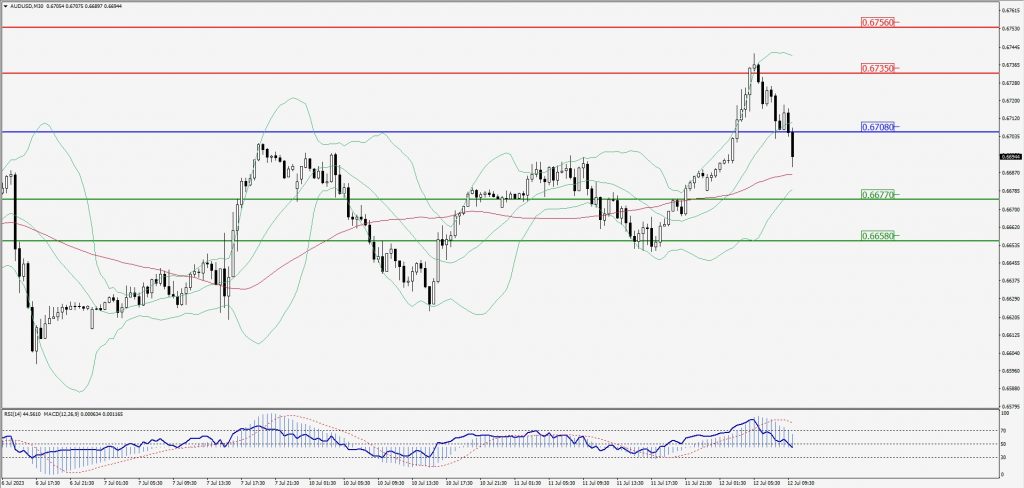
Green Lines Indicate Resistance Levels – Red Lines Indicate Support Levels
Light Blue is a Pivot Point – Black represents the price when the report was produced
CRUDEOIL Intraday: Support level at 74.56
Our pivot point is at 74.56
Preferable Price Action: Above pivot buy oil with 75.49 & 76.09 as targets.
Alternative Price Action: Sell crude below pivot with targets at 73.70 and 73.08 in extension.
Comment: MACD is positive territory and Pairs above 55MA.
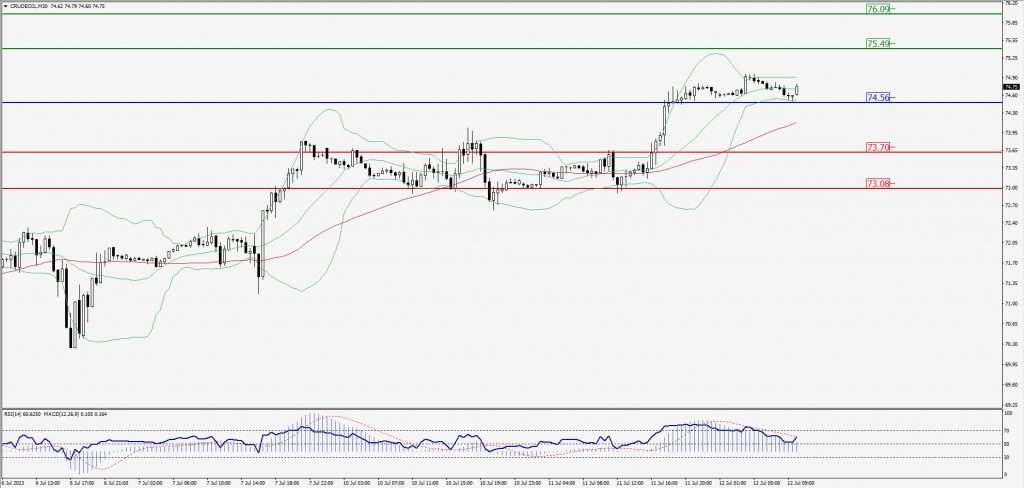
Green Lines Indicate Resistance Levels – Red Lines Indicate Support Levels
Light Blue is a Pivot Point – Black represents the price when the report was produced
XAU/USD Intraday: Trend on the downside
Our pivot point is 1938.30
Preferable Price Action: Further downside to 1930.30 and 1925.10.
Alternative Price Action: If the price gives an upside breakout of a pivot, then the price extends to 1945.40 and 1950.70.
Comment: MACD is below 50 level and Pairs below 20MA.
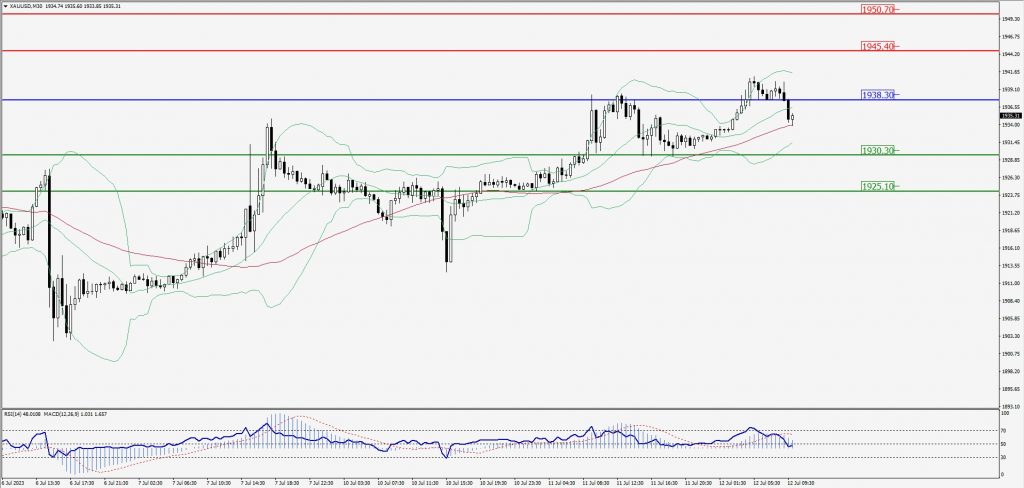
Green Lines Indicate Resistance Levels – Red Lines Indicate Support Levels
Light Blue is a Pivot Point – Black represents the price when the report was produced
Dow Jones Intraday: Major trend on the upside
Our pivot point is 34,231.00
Preferable Price Action: Take buy positions above the pivot with targets at 34,370.00 & 34,465.00.
Alternative Price Action: Below 34,231.00 looks for further downside to 34,119.00 & 34,029.00.
Comment: RSI is above 50 levels and Pairs above its 20MA & 55MA.
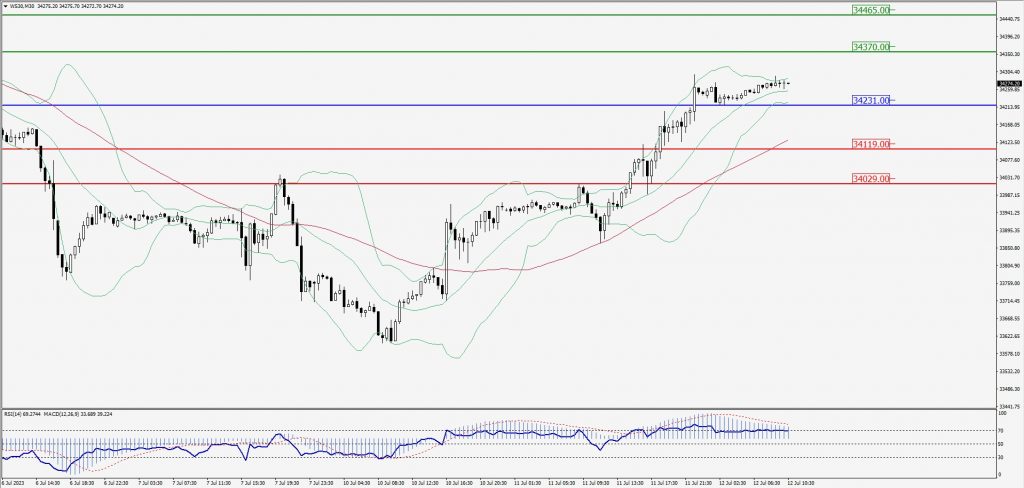
Green Lines Indicate Resistance Levels – Red Lines Indicate Support Levels
Light Blue is a Pivot Point – Black represents the price when the report was produced