Market Wrap: Stocks, Bonds, Commodities
Wall Street’s main indexes ended lower on Friday in a seesaw session, as investors digested a U.S. jobs report that showed weaker-than-expected growth and awaited more economic data and corporate earnings in the weeks ahead.
The Dow Jones Industrial Average fell 187.88 points to 33,734.88, the S&P 500 lose 0.29% to 4,398.95 and the Nasdaq Composite subtract 18.33 points to 13,660.72.
MSCI’s index of Asia-Pacific stocks outside Japan is advance 0.22% to 623.33 levels. The Australian index was lower by 0.54% to 7,004.00. Japanese Nikkei Index decline 0.61% today.
European stocks were negative on Monday, with the Stoxx Europe 50 Index rose 0.33% to 4,250.65, Germany’s DAX advance 0.29% to 15,649.85, and France’s CAC ascend 0.38% to 7,138.57 and U.K.’s FTSE 100 add 0.14% to 7,266.86.
Benchmark 10-year U.S. Treasury fell as demand for safe assets ascend again, today 10-year bond yields positive 0.72% to 4.0760.
Oil prices dipped in early Asian trade on Monday as investors tread cautiously ahead of fresh economic data from top consumers the United States and China this week, while expected crude supply cuts from Saudi Arabia and Russia supported the market.
Spot Brent crude oil drop 0.40% to $78.14 per barrel. US West Texas Intermediate crude is down 0.46% to $73.52 a barrel.
The yellow metal gold is advance 0.14% to 1,929.65 dollars per ounce.
Market Wrap: Forex
The dollar slumped on Friday after signs of a less resilient U.S. labor market reduced the outlook for how long the Federal Reserves will keep interest rates higher, while the yen surged on concerns the 10-year Treasury’s yield rose above 4%.
Today, the U.S. dollar index measures the Greenback against a trade-weighted basket of six major currencies, which surged 0.12% to 102.070.
The Euro US Dollar (EUR/USD) is a widely traded pair that is down 0.05% today. This left the pair trading around $1.09620.
The Japanese yen was negative against the U.S. dollar on Monday. Today USD/JPY is surged 0.36% to the 142.590 level.
Another commodity-related currency negative against the U.S dollar, AUD/USD fell 0.76% to 0.66370, and NZD/USD slipped 0.42% to 0.61830 level.
EUR/USD Intraday: Trend on the upside
Our pivot point is at 1.09620
Preferable Price Action: Take buy positions above pivot level with targets at 1.09990 & 1.10250 in extension.
Alternative Price Action: Below pivot looks for a further downside to 1.09310 & 1.09080.
Comment: RSI is above 50 levels and Pairs above its 20MA & 55MA.
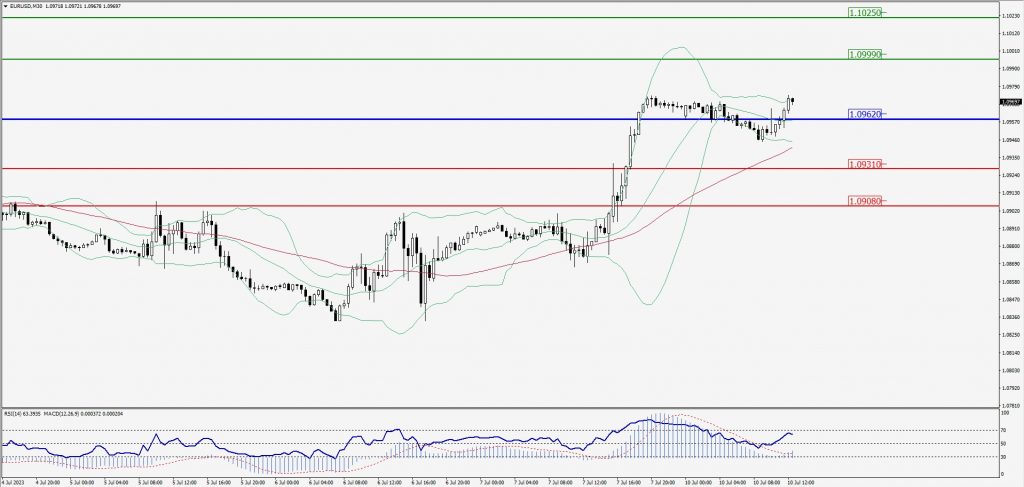
Green Lines Indicate Resistance Levels – Red Lines Indicate Support Levels
Light Blue is a Pivot Point – Black represents the price when the report was produced
GBP/USD Intraday: In a consolidation zone
Our pivot point is at 1.28050
Preferable Price Action: Buy positions above pivot with targets at 1.28370 & 1.28580 in extension.
Alternative Price Action: The price below pivot would call for further downside to 1.27760 & 1.27570.
Comment: RSI is at 50 levels and Pairs above 55MA.
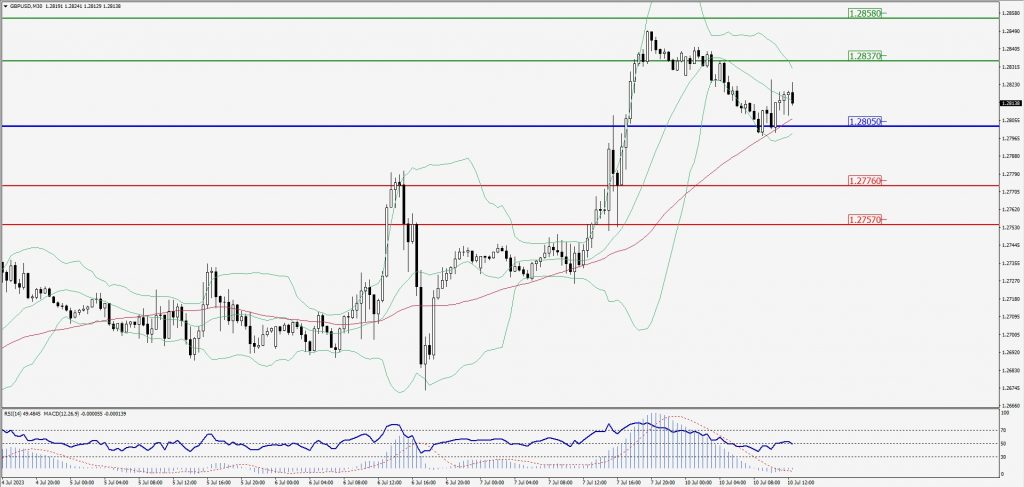
Green Lines Indicate Resistance Levels – Red Lines Indicate Support Levels
Light Blue is a Pivot Point – Black represents the price when the report was produced
USD/JPY Intraday: Trend on the downside
Our pivot point is at 142.780
Preferable Price Action: Sell position below pivot with the target at 142.090 and 141.650 in extension.
Alternative Price Action: The upside breakout of the pivot would call for 143.390 and 143.880.
Comment: MACD is below 50 level and Pairs below its 20MA & 55MA.
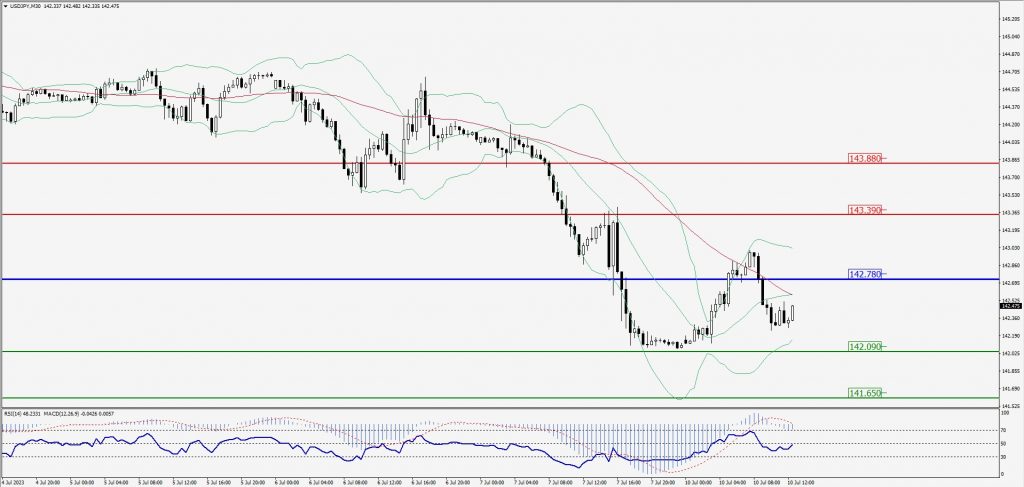
Green Lines Indicate Resistance Levels – Red Lines Indicate Support Levels
Light Blue is a Pivot Point – Black represents the price when the report was produced
AUD/USD Intraday: Major trend on the downside
Our pivot point is at 0.66490
Preferable Price Action: Sell positions below pivot with targets at 0.66140 & 0.65900 in extension.
Alternative Price Action: Above pivot looks for a further upside with 0.66850 & 0.67090 as targets.
Comment: RSI is below 50 levels and Pairs below its 20MA & 55MA.
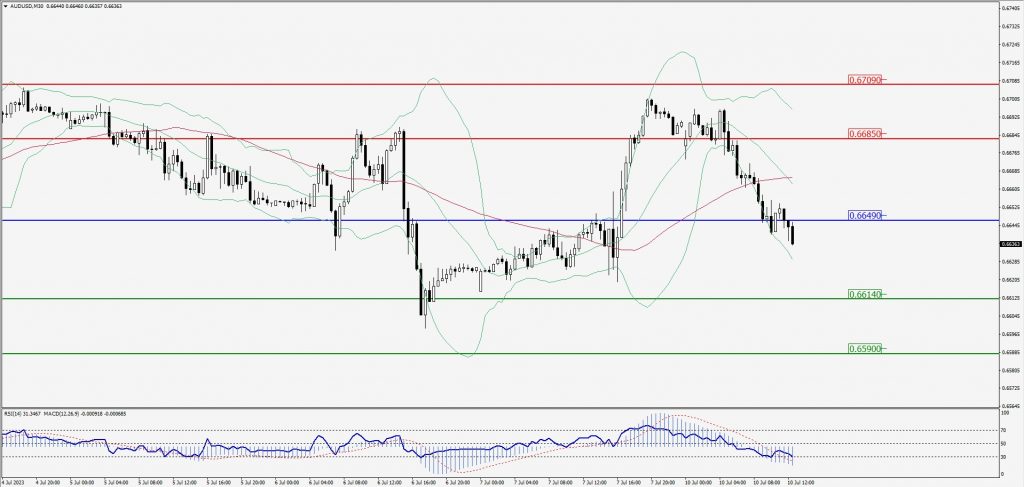
Green Lines Indicate Resistance Levels – Red Lines Indicate Support Levels
Light Blue is a Pivot Point – Black represents the price when the report was produced
CRUDEOIL Intraday: In a consolidation zone
Our pivot point is at 72.98
Preferable Price Action: Above pivot buy oil with 74.04 & 74.82 as targets.
Alternative Price Action: Sell crude below pivot with targets at 72.04 and 71.42 in extension.
Comment: MACD is positive territory and Pairs above 55MA.
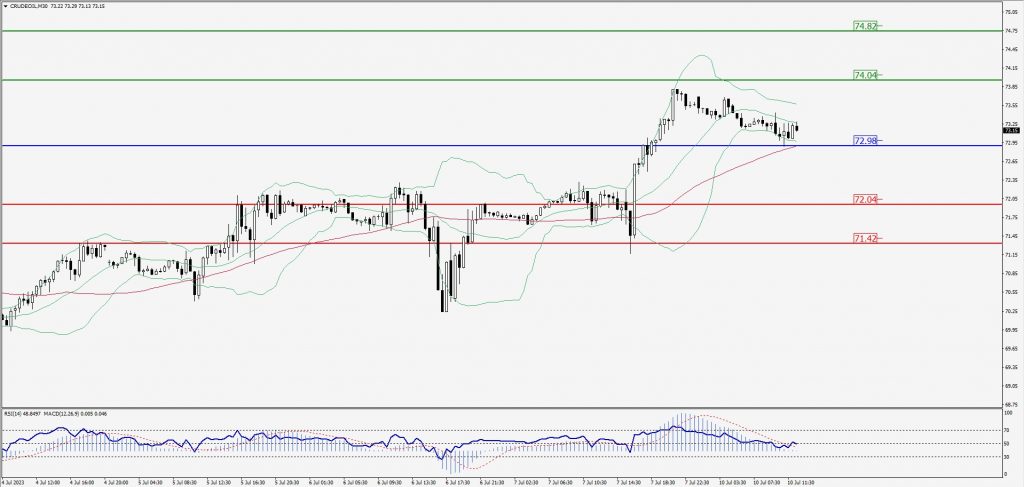
Green Lines Indicate Resistance Levels – Red Lines Indicate Support Levels
Light Blue is a Pivot Point – Black represents the price when the report was produced
XAU/USD Intraday: Resistance level at 1925.70
Our pivot point is 1925.70
Preferable Price Action: Further downside to 1918.50 and 1913.70.
Alternative Price Action: If the price gives an upside breakout of a pivot, then the price extends to 1931.80 and 1936.10.
Comment: MACD is below 50 level.
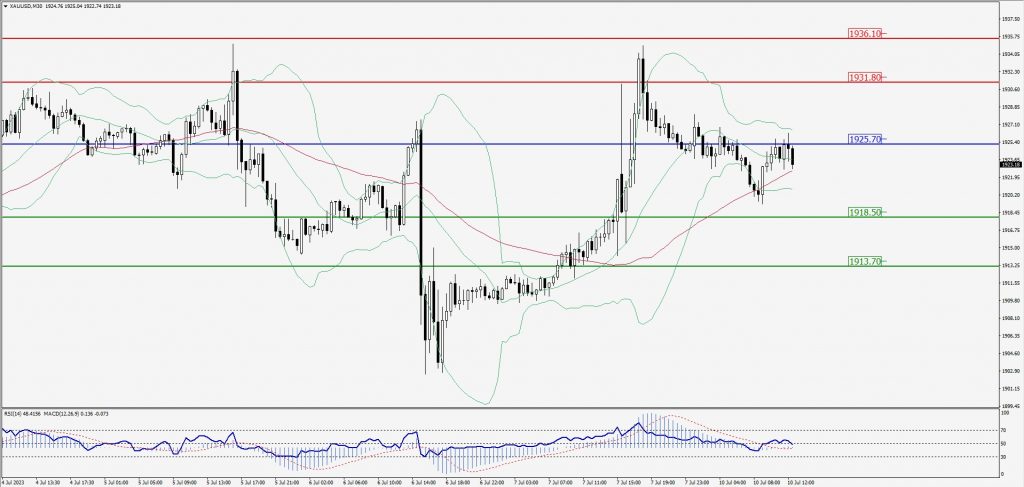
Green Lines Indicate Resistance Levels – Red Lines Indicate Support Levels
Light Blue is a Pivot Point – Black represents the price when the report was produced
Dow Jones Intraday: In a consolidation zone
Our pivot point is 33,794.00
Preferable Price Action: Take sell positions below the pivot with targets at 33,634.00 & 33,5326.00.
Alternative Price Action: Above 33,794.00 looks for further upside to 33,929.00 & 34,036.00.
Comment: RSI is at 50 levels and Pairs below 55MA.
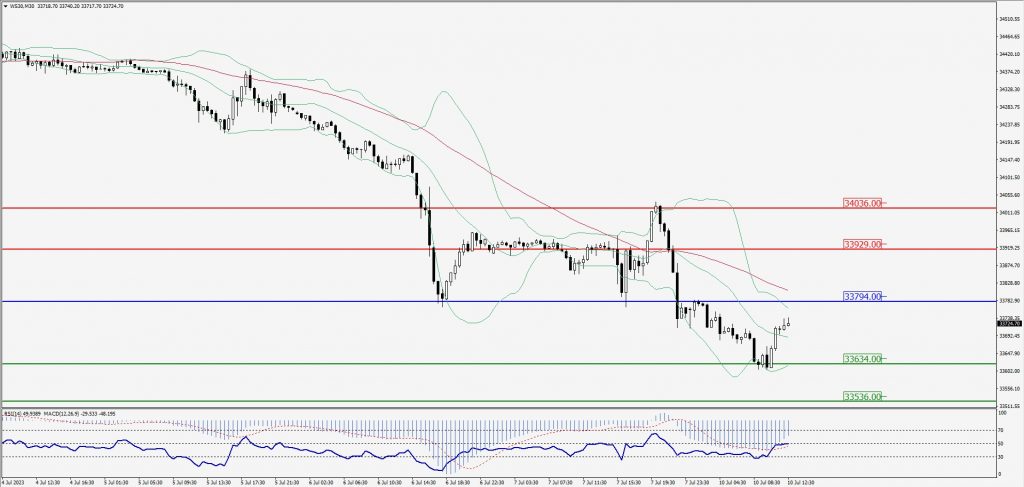
Green Lines Indicate Resistance Levels – Red Lines Indicate Support Levels
Light Blue is a Pivot Point – Black represents the price when the report was produced