Market Wrap: Stocks, Bonds, Commodities
Wall Street’s main indexes ended with modest declines on Wednesday as investors digested minutes from the US Federal Reserve’s latest meeting and braced for significant economic data in the days to come.
The Dow Jones Industrial Average fell 129.83 points to 34,288.64, the S&P 500 lose 0.20% to 4,446.82 and the Nasdaq Composite add 25.12 points to 13,791.65.
MSCI’s index of Asia-Pacific stocks outside Japan is decline 1.65% to 627.44 levels. The Australian index was lower by 1.24% to 7,163.40. Japanese Nikkei Index decline 1.70% today.
European stocks were negative on Thursday, with the Stoxx Europe 50 Index fell 1.31% to 4,293.75, Germany’s DAX decline 0.91% to 15,793.35, and France’s CAC drop 1.58% to 7,194.21 and U.K.’s FTSE 100 subtract 1.12% to 7,358.81.
Benchmark 10-year U.S. Treasury fell as demand for safe assets ascend again, today 10-year bond yields positive 0.86% to 3.9790.
US crude oil gained about 3% on Wednesday, narrowing the price gap with global benchmark Brent in a post-holiday response to supply cuts announced on Monday by Saudi Arabia and Russia.
Spot Brent crude oil ascend 0.48% to $77.02 per barrel. US West Texas Intermediate crude is up 0.63% to $72.25 a barrel.
The yellow metal gold is decline 0.15% to 1,924.55 dollars per ounce.
Market Wrap: Forex
The U.S. dollar edged lower in early European hours Thursday, handing back some of its overnight gains after the minutes from the Federal Reserve’s last meeting pointed to another rate hike later this month.
Today, the U.S. dollar index measures the Greenback against a trade-weighted basket of six major currencies, which slipped 0.08% to 102.950.
The Euro US Dollar (EUR/USD) is a widely traded pair that is up 0.11% today. This left the pair trading around $1.08630.
The Japanese yen was negative against the U.S. dollar on Thursday. Today USD/JPY is slipped 0.43% to the 144.030 level.
Another commodity-related currency positive against the U.S dollar, AUD/USD rose 0.23% to 0.66690, and NZD/USD surged 0.28% to 0.61950 level.
EUR/USD Intraday: Trend on the upside
Our pivot point is at 1.08550
Preferable Price Action: Take buy positions above pivot level with targets at 1.08760 & 1.08920 in extension.
Alternative Price Action: Below pivot looks for a further downside to 1.08350 & 1.08210.
Comment: RSI is above 50 levels and Pairs above 20MA.
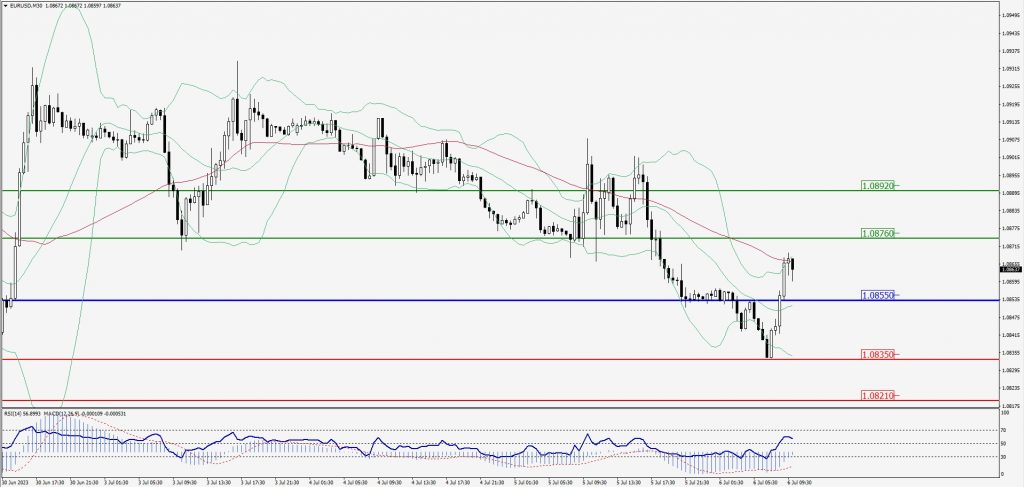
Green Lines Indicate Resistance Levels – Red Lines Indicate Support Levels
Light Blue is a Pivot Point – Black represents the price when the report was produced
GBP/USD Intraday: Resistance level at 1.27120
Our pivot point is at 1.27120
Preferable Price Action: Sell positions below pivot with targets at 1.26860 & 1.26690 in extension.
Alternative Price Action: The price above pivot would call for further upside to 1.27370 & 1.27560.
Comment: RSI is below 50 levels and Pairs below its 20MA & 55MA.
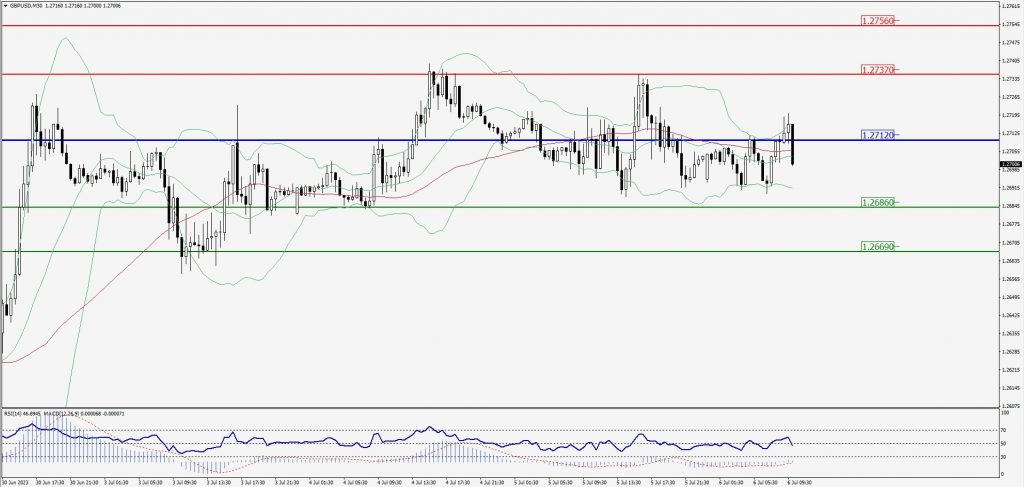
Green Lines Indicate Resistance Levels – Red Lines Indicate Support Levels
Light Blue is a Pivot Point – Black represents the price when the report was produced
USD/JPY Intraday: Major trend on the downside
Our pivot point is at 143.870
Preferable Price Action: Sell position below pivot with the target at 143.560 and 143.340 in extension.
Alternative Price Action: The upside breakout of the pivot would call for 144.120 and 144.330.
Comment: MACD is below 50 level and Pairs below its 20MA & 55MA.
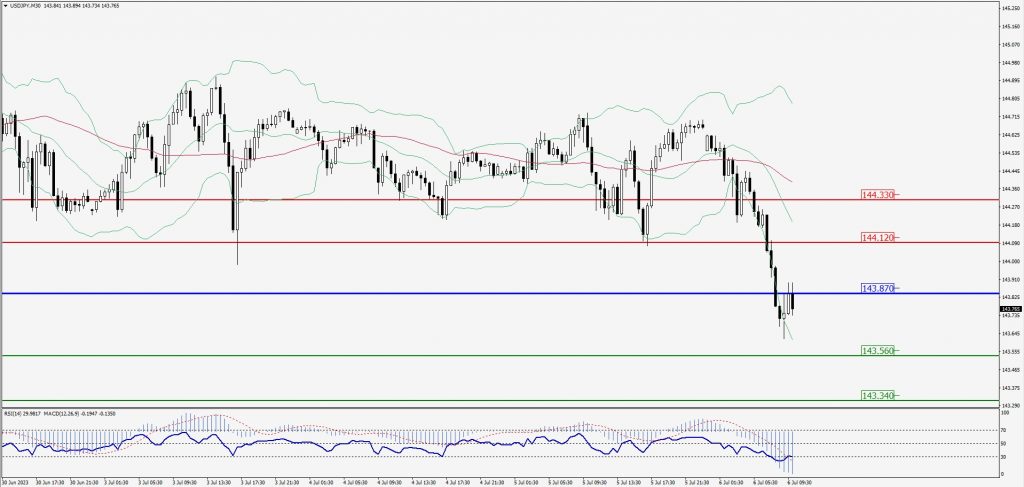
Green Lines Indicate Resistance Levels – Red Lines Indicate Support Levels
Light Blue is a Pivot Point – Black represents the price when the report was produced
AUD/USD Intraday: Trend on the upside
Our pivot point is at 0.66730
Preferable Price Action: Buy positions above pivot with targets at 0.66940 & 0.67090 in extension.
Alternative Price Action: Below pivot looks for a further downside with 0.66540 & 0.66390 as targets.
Comment: RSI is above 50 levels and Pairs above its 20MA & 55MA.
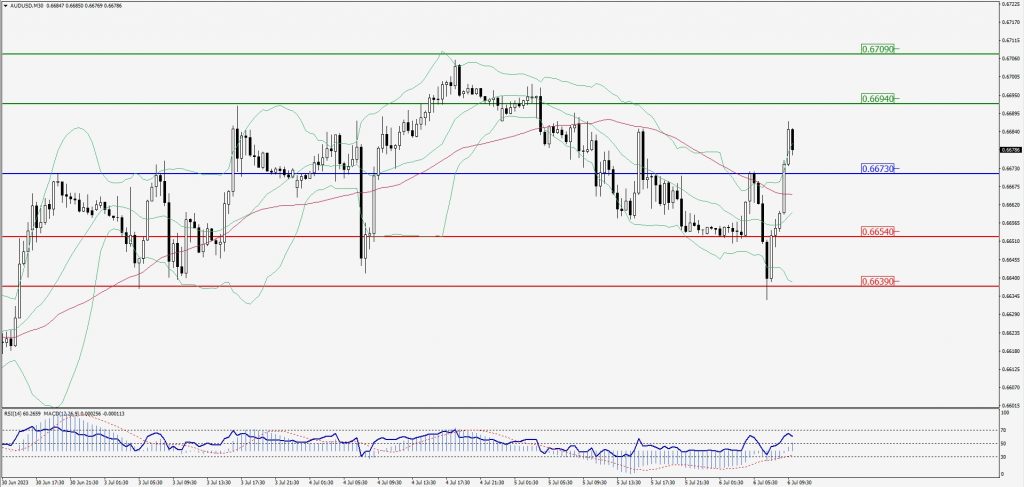
Green Lines Indicate Resistance Levels – Red Lines Indicate Support Levels
Light Blue is a Pivot Point – Black represents the price when the report was produced
CRUDEOIL Intraday: In a consolidation zone
Our pivot point is at 71.63
Preferable Price Action: Above pivot buy oil with 72.27 & 72.74 as targets.
Alternative Price Action: Sell crude below pivot with targets at 70.96 and 70.49 in extension.
Comment: MACD is flat territory and Pairs above 55MA.
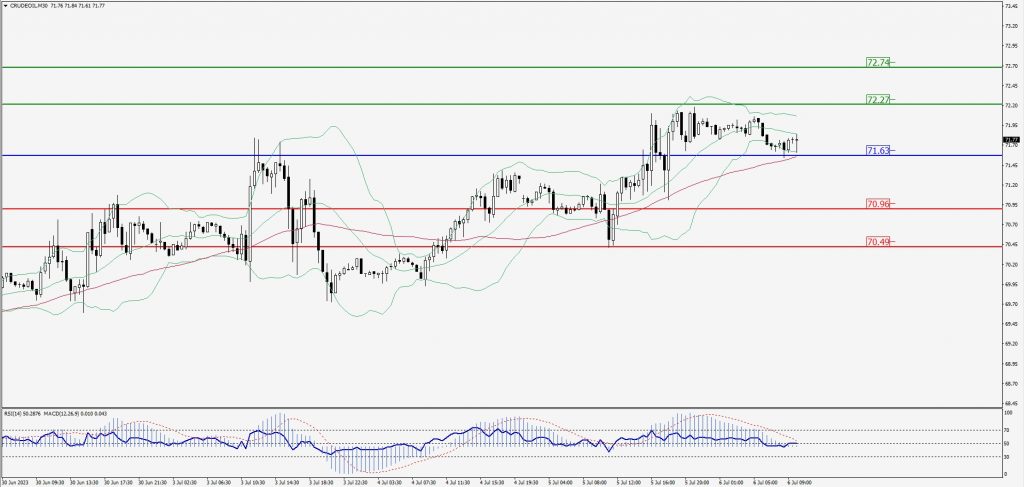
Green Lines Indicate Resistance Levels – Red Lines Indicate Support Levels
Light Blue is a Pivot Point – Black represents the price when the report was produced
XAU/USD Intraday: Trend on the upside
Our pivot point is 1918.20
Preferable Price Action: Further upside to 1924.20 and 1928.30.
Alternative Price Action: If the price gives a downside breakout of a pivot, then the price extends to 1913.10 and 1909.40.
Comment: MACD is above 50 level and Pairs above 20MA.
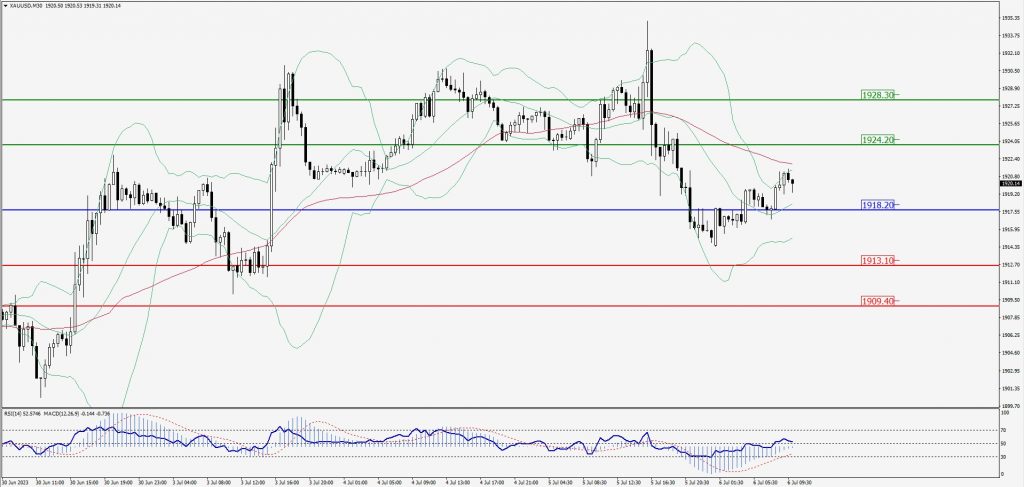
Green Lines Indicate Resistance Levels – Red Lines Indicate Support Levels
Light Blue is a Pivot Point – Black represents the price when the report was produced
Dow Jones Intraday: Major trend on the downside
Our pivot point is 34,193.00
Preferable Price Action: Take sell positions below the pivot with targets at 34,107.00 & 34,058.00.
Alternative Price Action: Above 34,193.00 looks for further upside to 34,268.00 & 34,320.00.
Comment: RSI is below 50 levels and Pairs below its 20MA & 55MA.
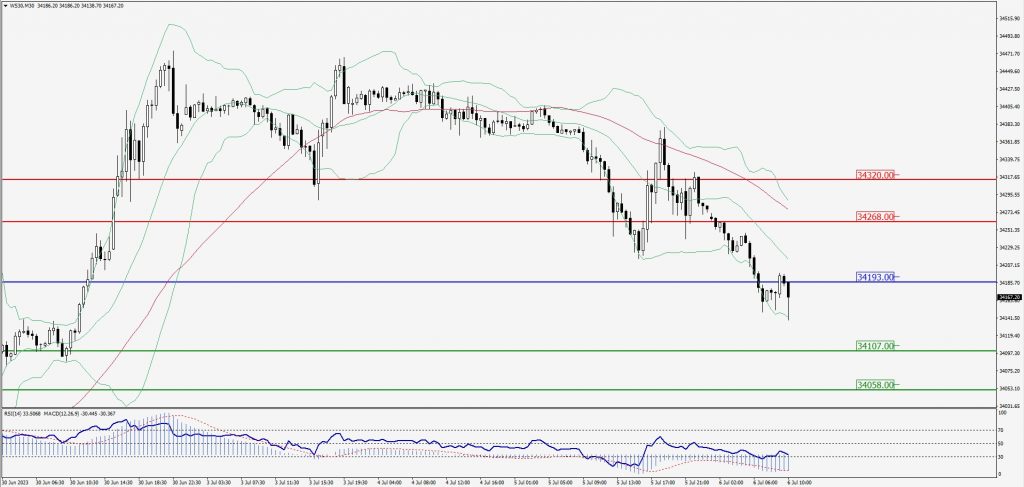
Green Lines Indicate Resistance Levels – Red Lines Indicate Support Levels
Light Blue is a Pivot Point – Black represents the price when the report was produced