Market Wrap: Stocks, Bonds, Commodities
Wall Street’s main indices ended with slim gains in a holiday-shortened session on Monday, helped by a surge in Tesla and strength in bank shares as the second half of the year kicked off on a subdued note.
The Dow Jones Industrial Average rose 10.87 points to 34,418.47, the S&P 500 gain 0.12% to 4,455.59 and the Nasdaq Composite add 28.85 points to 13,816.77.
MSCI’s index of Asia-Pacific stocks outside Japan is advance 0.41% to 643.12 levels. The Australian index was higher by 0.45% to 7,279.00. Japanese Nikkei Index decline 0.98% today.
European stocks were mixed on Tuesday, with the Stoxx Europe 50 Index rose 0.16% to 4,405.25, Germany’s DAX decline 0.04% to 16,073.25, and France’s CAC ascend 0.07% to 7,390.82 and U.K.’s FTSE 100 add 0.07% to 7,532.27.
Benchmark 10-year U.S. Treasury fell as demand for safe assets ascend again, today 10-year bond yields positive 1.42% to 3.8730.
Oil prices held steady on Tuesday as markets weighed supply woes from cuts for August by top exporters Saudi Arabia and Russia against economic data that hinted at weak crude demand.
Spot Brent crude oil ascend 0.92% to $75.34 per barrel. US West Texas Intermediate crude is up 0.97% to $70.48 a barrel.
The yellow metal gold is advance 0.33% to 1,935.90 dollars per ounce.
Market Wrap: Forex
The U.S. dollar stabilized in early European hours Tuesday in holiday-impacted trade, while the Aussie dollar retreated after the Reserve Bank held rates steady at its latest policy-setting meeting.
Today, the U.S. dollar index measures the Greenback against a trade-weighted basket of six major currencies, which surged 0.05% to 102.700.
The Euro US Dollar (EUR/USD) is a widely traded pair that is down 0.16% today. This left the pair trading around $1.08940.
The Japanese yen was negative against the U.S. dollar on Tuesday. Today USD/JPY is slipped 0.20% to the 144.380 level.
Another commodity-related currency positive against the U.S dollar, AUD/USD rose 0.16% to 0.66800, and NZD/USD surged 0.42% to 0.61770 level.
EUR/USD Intraday: Trend on the upside
Our pivot point is at 1.09040
Preferable Price Action: Take buy positions above pivot level with targets at 1.09300 & 1.09490 in extension.
Alternative Price Action: Below pivot looks for a further downside to 1.08780 & 1.08600.
Comment: RSI is above 50 levels and Pairs above its 20MA & 55MA.
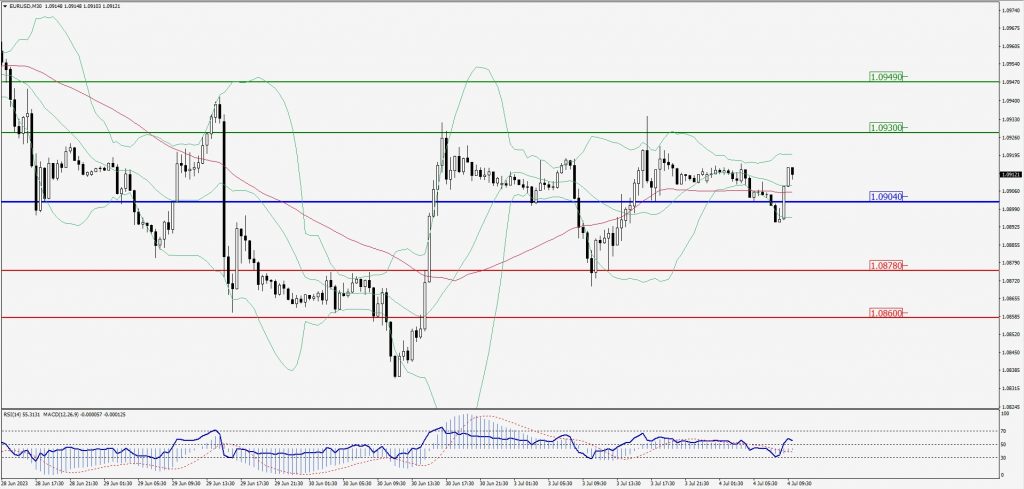
Green Lines Indicate Resistance Levels – Red Lines Indicate Support Levels
Light Blue is a Pivot Point – Black represents the price when the report was produced
GBP/USD Intraday: Support level at 1.26960
Our pivot point is at 1.26960
Preferable Price Action: Buy positions above pivot with targets at 1.27250 & 1.27460 in extension.
Alternative Price Action: The price below pivot would call for further downside to 1.26720 & 1.26540.
Comment: RSI is above 50 levels and Pairs above its 20MA & 55MA.
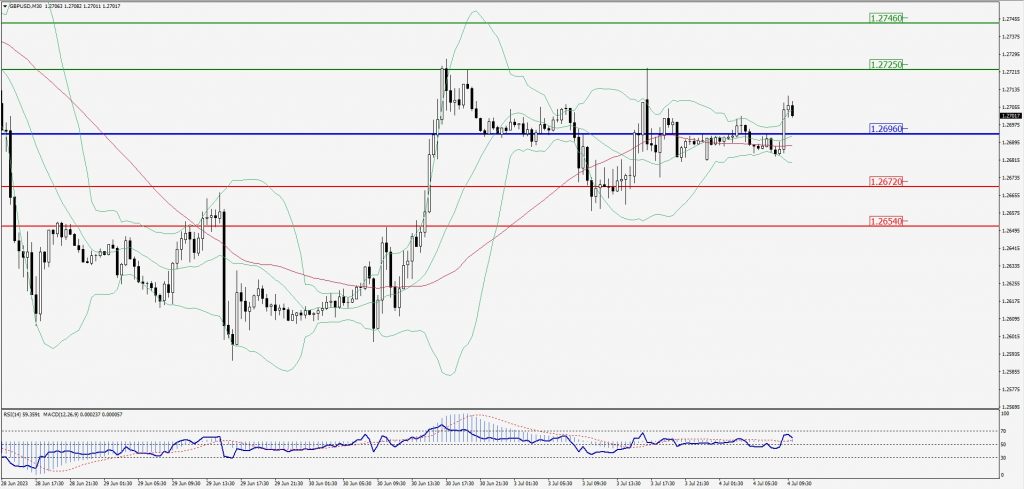
Green Lines Indicate Resistance Levels – Red Lines Indicate Support Levels
Light Blue is a Pivot Point – Black represents the price when the report was produced
USD/JPY Intraday: Trend on the downside
Our pivot point is at 144.600
Preferable Price Action: Sell position below pivot with the target at 144.210 and 143.990 in extension.
Alternative Price Action: The upside breakout of the pivot would call for 144.970 and 145.180.
Comment: MACD is below 50 level and Pairs below its 20MA & 55MA.
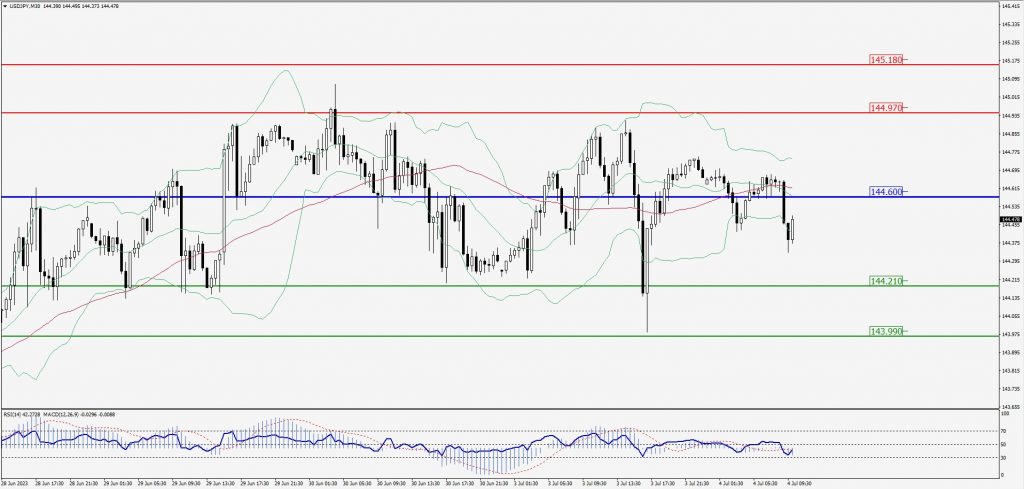
Green Lines Indicate Resistance Levels – Red Lines Indicate Support Levels
Light Blue is a Pivot Point – Black represents the price when the report was produced
AUD/USD Intraday: Trend on the upside
Our pivot point is at 0.66720
Preferable Price Action: Buy positions above pivot with targets at 0.67000 & 0.67190 in extension.
Alternative Price Action: Below pivot looks for a further downside with 0.66490 & 0.66310 as targets.
Comment: RSI is above 50 levels and Pairs above its 20MA & 55MA.
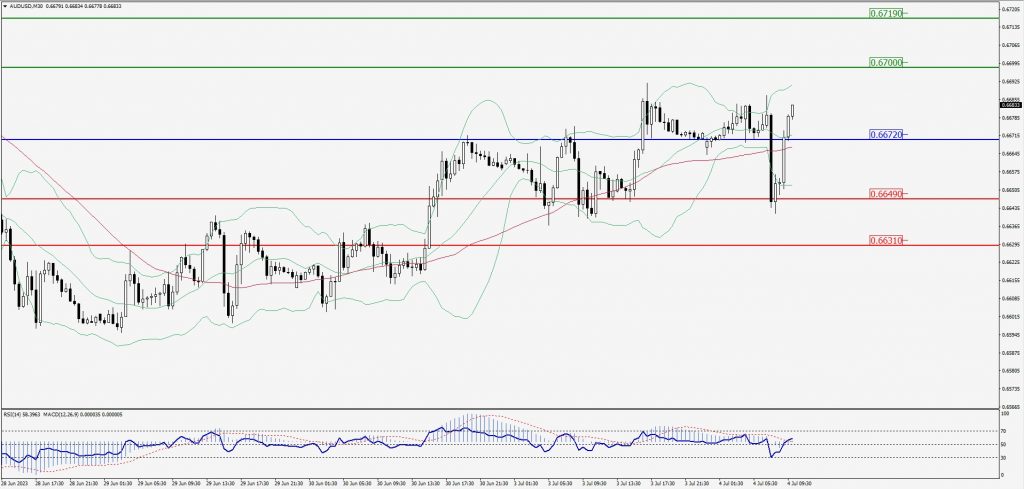
Green Lines Indicate Resistance Levels – Red Lines Indicate Support Levels
Light Blue is a Pivot Point – Black represents the price when the report was produced
CRUDEOIL Intraday: Support level at 70.13
Our pivot point is at 70.13
Preferable Price Action: Above pivot buy oil with 71.00 & 71.59 as targets.
Alternative Price Action: Sell crude below pivot with targets at 69.44 and 68.94 in extension.
Comment: MACD is positive territory and Pairs above 20MA.
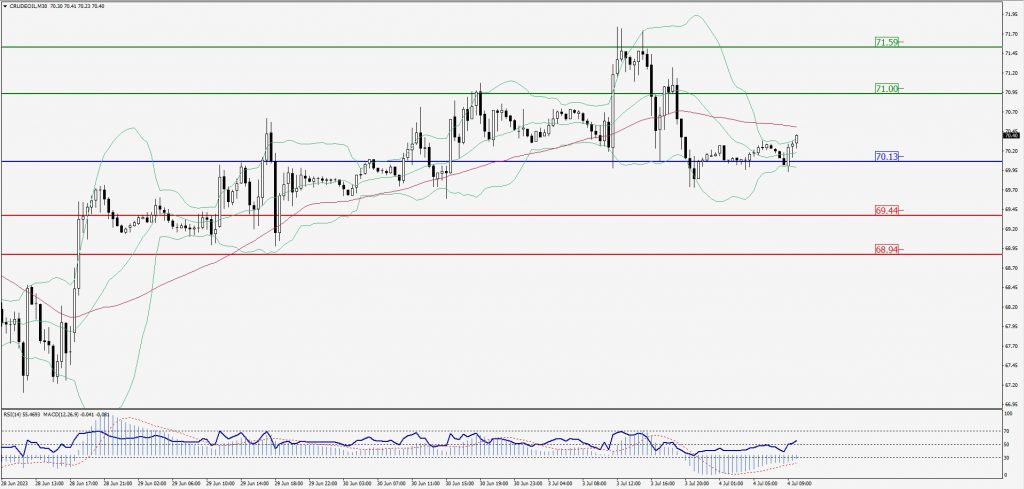
Green Lines Indicate Resistance Levels – Red Lines Indicate Support Levels
Light Blue is a Pivot Point – Black represents the price when the report was produced
XAU/USD Intraday: Major trend on the upside
Our pivot point is 1924.40
Preferable Price Action: Further upside to 1932.90 and 1939.00.
Alternative Price Action: If the price gives a downside breakout of a pivot, then the price extends to 1917.20 and 1911.40.
Comment: MACD is above 50 level and Pairs above its 20MA & 55MA.
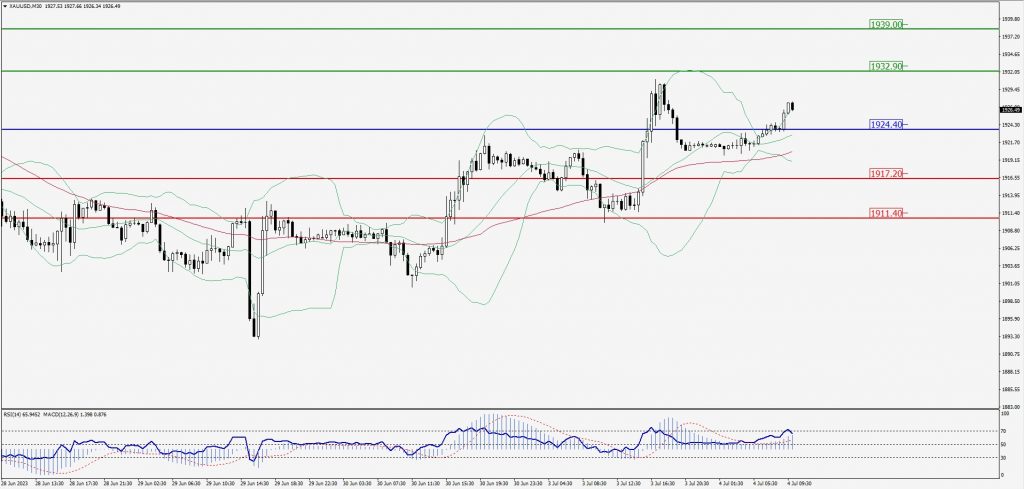
Green Lines Indicate Resistance Levels – Red Lines Indicate Support Levels
Light Blue is a Pivot Point – Black represents the price when the report was produced
Dow Jones Intraday: In a consolidation zone
Our pivot point is 34,387.00
Preferable Price Action: Take buy positions above the pivot with targets at 34,507.00 & 34,596.00.
Alternative Price Action: Below 34,387.00 looks for further downside to 34,294.00 & 34,211.00.
Comment: RSI is at 50 levels and Pairs above 55MA.
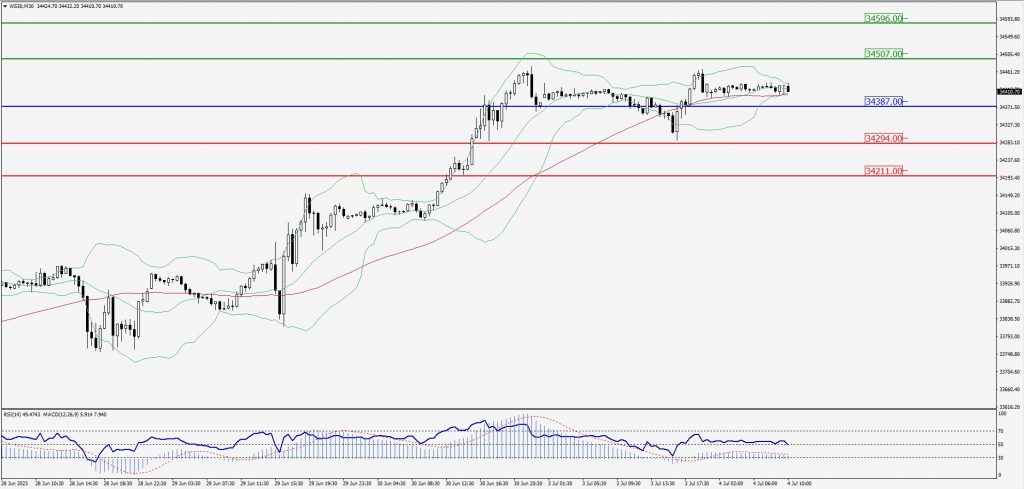
Green Lines Indicate Resistance Levels – Red Lines Indicate Support Levels
Light Blue is a Pivot Point – Black represents the price when the report was produced