Market Wrap: Stocks, Bonds, Commodities
US equity futures were little changed on Thursday evening as investors awaited the latest data on personal consumption expenditures, the Federal Reserve’s favoured inflation gauge.
The Dow Jones Industrial Average rose 269.76 points to 34,122.42, the S&P 500 gain 0.45% to 4,396.44 and the Nasdaq Composite subtract 0.42 points to 13,591.33.
MSCI’s index of Asia-Pacific stocks outside Japan is decline 0.12% to 630.16 levels. The Australian index was higher by 0.12% to 7,203.30. Japanese Nikkei Index decline 0.14% today.
European stocks were positive on Friday, with the Stoxx Europe 50 Index rose 0.44% to 4,373.95, Germany’s DAX advance 0.77% to 16,069.95, and France’s CAC ascend 0.73% to 7,366.43 and U.K.’s FTSE 100 add 0.50% to 7,508.38.
Benchmark 10-year U.S. Treasury fell as demand for safe assets ascend again, today 10-year bond yields positive 0.83% to 3.8830.
Oil prices edged lower on Thursday, as fears that rising interest rates could dent global economic growth and crude demand offset a bigger-than-expected fall in U.S. inventories.
Spot Brent crude oil ascend 0.89% to $75.17 per barrel. US West Texas Intermediate crude is up 0.86% to $70.44 a barrel.
The yellow metal gold is decline 0.43% to 1,909.65 dollars per ounce.
Market Wrap: Forex
The U.S. dollar stabilized in early European trade Friday, but is on course to record strong quarterly gains as traders anticipate the U.S. Federal Reserve raising interest rates further as the year progresses.
Today, the U.S. dollar index measures the Greenback against a trade-weighted basket of six major currencies, which surged 0.17% to 103.180.
The Euro US Dollar (EUR/USD) is a widely traded pair that is down 0.21% today. This left the pair trading around $1.08400.
The Japanese yen was negative against the U.S. dollar on Friday. Today USD/JPY is surged 0.02% to the 144.790 level.
Another commodity-related currency positive against the U.S dollar, AUD/USD rose 0.07% to 0.66190, and NZD/USD surged 0.23% to 0.60820 level.
EUR/USD Intraday: Resistance level at 1.08770
Our pivot point is at 1.08770
Preferable Price Action: Take sell positions below pivot level with targets at 1.08310 & 1.08030 in extension.
Alternative Price Action: Above pivot looks for a further upside to 1.09170 & 1.09480.
Comment: RSI is below 50 levels and Pairs below its 20MA & 55MA.
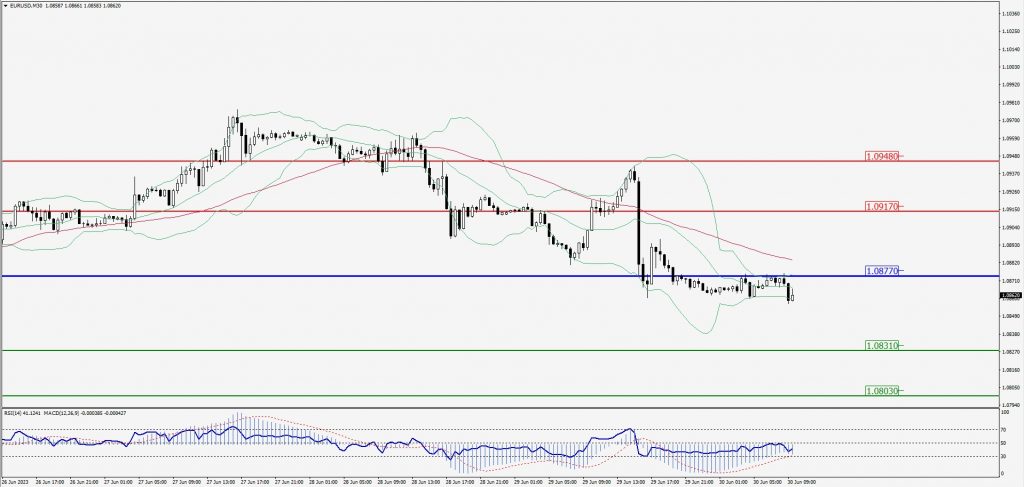
Green Lines Indicate Resistance Levels – Red Lines Indicate Support Levels
Light Blue is a Pivot Point – Black represents the price when the report was produced
GBP/USD Intraday: In a consolidation zone
Our pivot point is at 1.26380
Preferable Price Action: Sell positions below pivot with targets at 1.25840 & 1.25520 in extension.
Alternative Price Action: The price above pivot would call for further upside to 1.26820 & 1.27140.
Comment: RSI is at 50 levels and Pairs below 55MA.
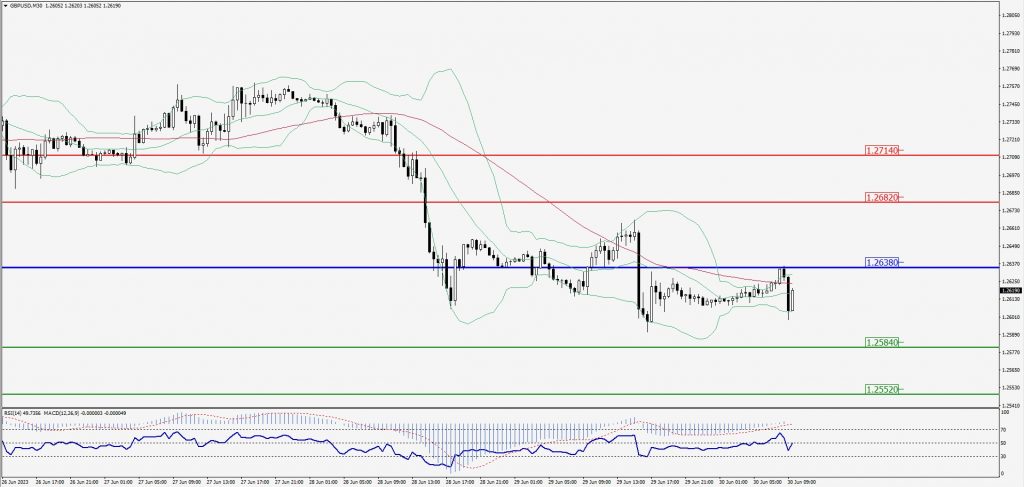
Green Lines Indicate Resistance Levels – Red Lines Indicate Support Levels
Light Blue is a Pivot Point – Black represents the price when the report was produced
USD/JPY Intraday: Trend on the downside
Our pivot point is at 144.810
Preferable Price Action: Sell position below pivot with the target at 144.380 and 144.090 in extension.
Alternative Price Action: The upside breakout of the pivot would call for 145.230 and 145.540.
Comment: MACD is below 50 level and Pairs below its 20MA & 55MA.
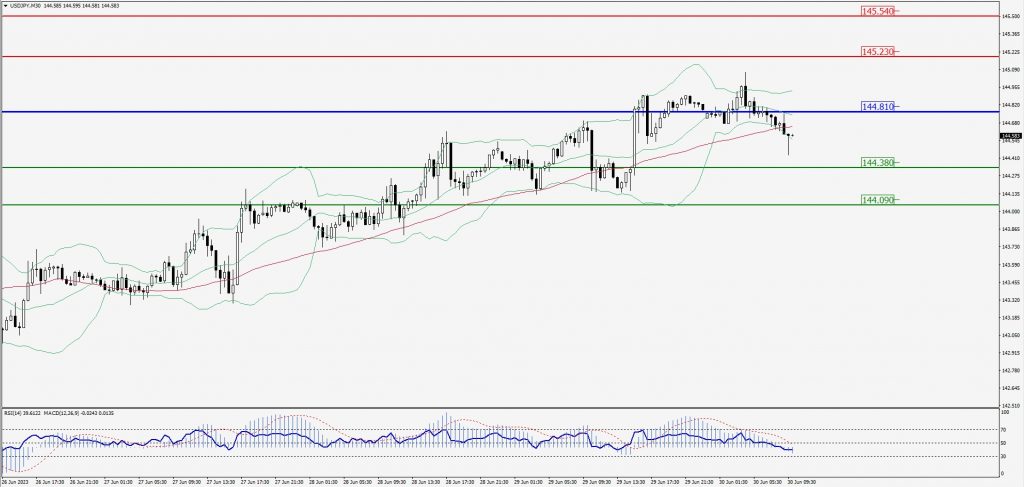
Green Lines Indicate Resistance Levels – Red Lines Indicate Support Levels
Light Blue is a Pivot Point – Black represents the price when the report was produced
AUD/USD Intraday: Trend on the upside
Our pivot point is at 0.66230
Preferable Price Action: Buy positions above pivot with targets at 0.66440 & 0.66610 in extension.
Alternative Price Action: Below pivot looks for a further downside with 0.66020 & 0.65870 as targets.
Comment: RSI is above 50 levels and Pairs above its 20MA & 55MA.
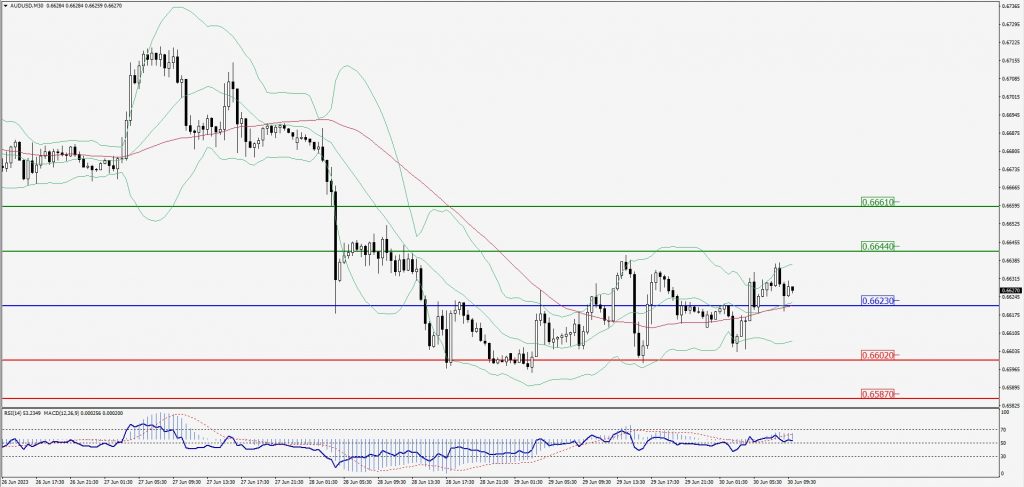
Green Lines Indicate Resistance Levels – Red Lines Indicate Support Levels
Light Blue is a Pivot Point – Black represents the price when the report was produced
CRUDEOIL Intraday: Support level at 69.83
Our pivot point is at 69.83
Preferable Price Action: Above pivot buy oil with 70.59 & 71.21 as targets.
Alternative Price Action: Sell crude below pivot with targets at 69.20 and 68.71 in extension.
Comment: MACD is positive territory and Pairs above 55MA.
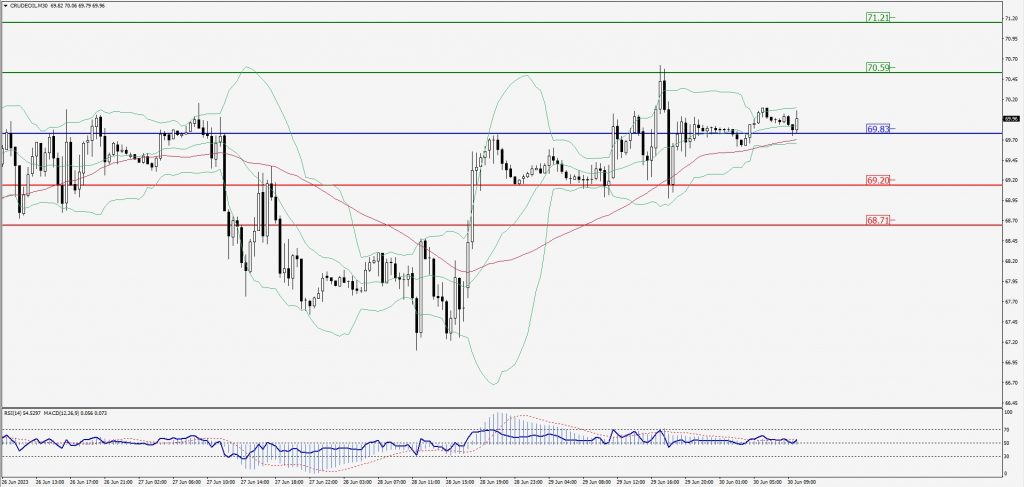
Green Lines Indicate Resistance Levels – Red Lines Indicate Support Levels
Light Blue is a Pivot Point – Black represents the price when the report was produced
XAU/USD Intraday: Resistance level at 1909.60
Our pivot point is 1909.60
Preferable Price Action: Further downside to 1900.20 and 1893.90.
Alternative Price Action: If the price gives an upside breakout of a pivot, then the price extends to 1917.70 and 1923.90.
Comment: MACD is below 50 level and Pairs below 20MA.
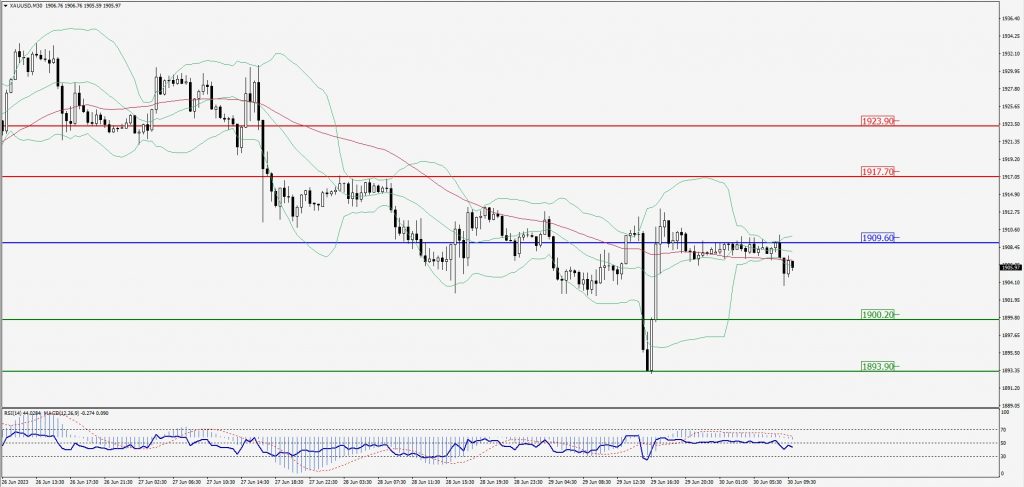
Green Lines Indicate Resistance Levels – Red Lines Indicate Support Levels
Light Blue is a Pivot Point – Black represents the price when the report was produced
Dow Jones Intraday: Trend on the upside
Our pivot point is 34,074.00
Preferable Price Action: Take buy positions above the pivot with targets at 34,184.00 & 34,253.00.
Alternative Price Action: Below 34,074.00 looks for further downside to 33,984.00 & 33,912.00.
Comment: RSI is above 50 levels and Pairs above 55MA.
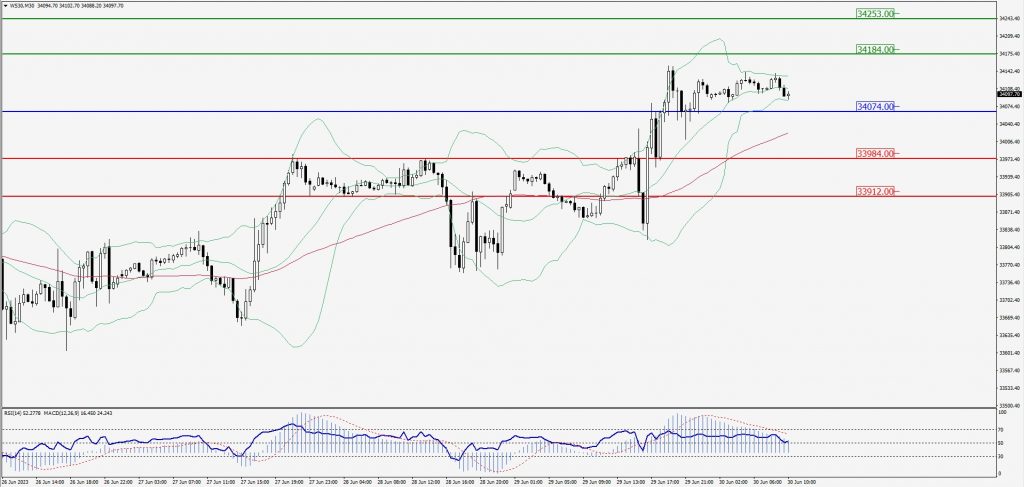
Green Lines Indicate Resistance Levels – Red Lines Indicate Support Levels
Light Blue is a Pivot Point – Black represents the price when the report was produced