Market Wrap: Stocks, Bonds, Commodities
Dow Jones Industrial Average futures were little changed. During Tuesday’s trading, the Dow Jones Industrial Average posted its first positive session in seven, with the index closing 0.63 percent higher.
The Dow Jones Industrial Average rose 212.03 points to 33,926.74, the S&P 500 gain 1.15% to 4,378.41 and the Nasdaq Composite add 219.90 points to 13,555.67.
MSCI’s index of Asia-Pacific stocks outside Japan is decline 0.11% to 634.02 levels. The Australian index was higher by 1.10% to 7,196.50. Japanese Nikkei Index advance 2.02% today.
European stocks were positive on Wednesday, with the Stoxx Europe 50 Index rose 0.65% to 4,333.25, Germany’s DAX advance 0.70% to 15,958.25, and France’s CAC ascend 0.67% to 7,264.00 and U.K.’s FTSE 100 add 0.38% to 7,489.12.
Benchmark 10-year U.S. Treasury fell as demand for safe assets ascend again, today 10-year bond yields negative 0.53% to 3.7510.
Oil prices slumped over 2 percent on Tuesday on signals that central banks may not be done with interest rate hikes, while investors awaited data that could shed light on U.S. fuel consumption during the peak summer driving season.
Spot Brent crude oil drop 0.62% to $72.05 per barrel. US West Texas Intermediate crude is down 0.69% to $67.25 a barrel.
The yellow metal gold is decline 0.31% to 1,917.65 dollars per ounce.
Market Wrap: Forex
The dollar rose against the rouble on Wednesday, although it had pulled back from the 15-month high hit earlier in the session, while the Japanese yen gained modestly against the greenback following comments from the country’s top currency diplomat.
Today, the U.S. dollar index measures the Greenback against a trade-weighted basket of six major currencies, which surged 0.11% to 102.230.
The Euro US Dollar (EUR/USD) is a widely traded pair that is down 0.02% today. This left the pair trading around $1.09560.
The Japanese yen was negative against the U.S. dollar on Wednesday. Today USD/JPY is slipped 0.01% to the 144.050 level.
Another commodity-related currency negative against the U.S dollar, AUD/USD fell 0.64% to 0.66410, and NZD/USD slipped 1.15% to 0.60910 level.
EUR/USD Intraday: Trend on the downside
Our pivot point is at 1.09560
Preferable Price Action: Take sell positions below pivot level with targets at 1.09260 & 1.09070 in extension.
Alternative Price Action: Above pivot looks for a further upside to 1.09870 & 1.10070.
Comment: RSI is below 50 levels and Pairs below its 20MA & 55MA.
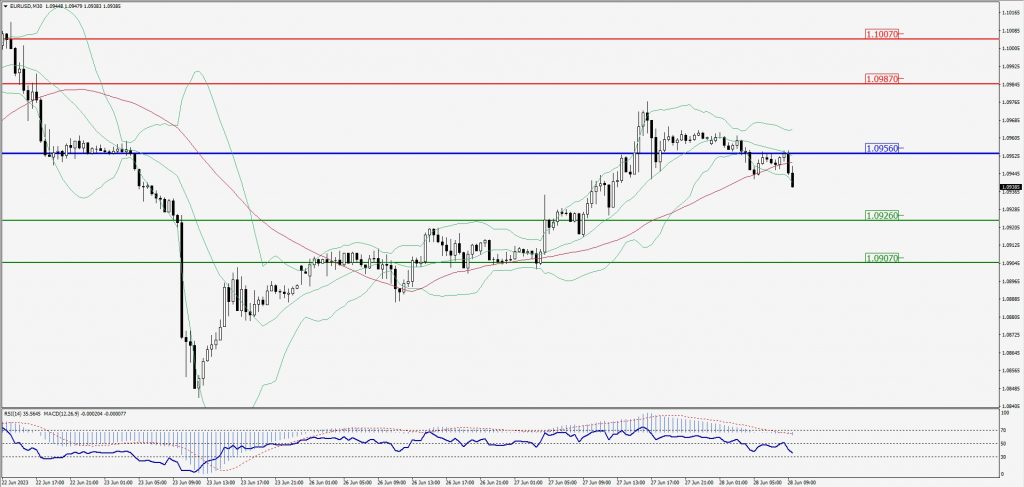
Green Lines Indicate Resistance Levels – Red Lines Indicate Support Levels
Light Blue is a Pivot Point – Black represents the price when the report was produced
GBP/USD Intraday: Resistance level at 1.27370
Our pivot point is at 1.27370
Preferable Price Action: Sell positions below pivot with targets at 1.26930 & 1.26660 in extension.
Alternative Price Action: The price above pivot would call for further upside to 1.27750 & 1.28040.
Comment: RSI is below 50 levels and Pairs below its 20MA & 55MA.
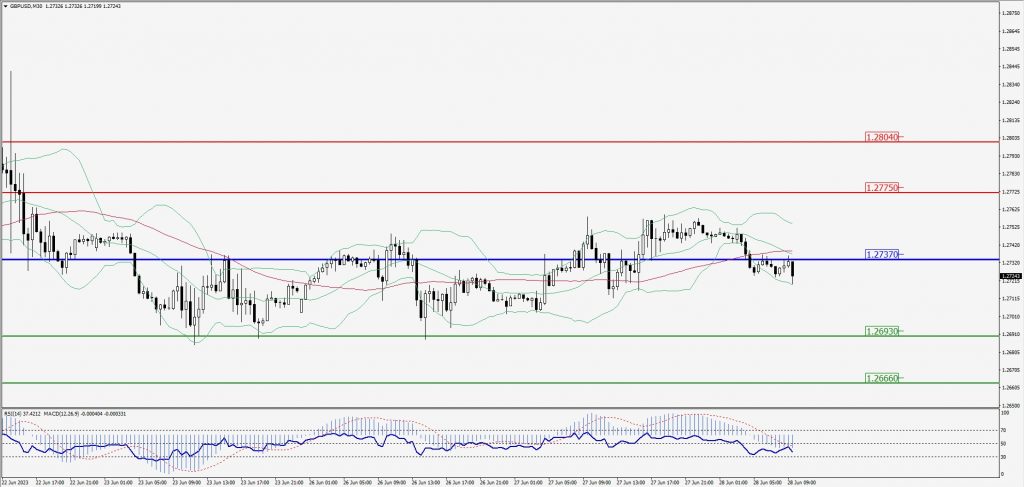
Green Lines Indicate Resistance Levels – Red Lines Indicate Support Levels
Light Blue is a Pivot Point – Black represents the price when the report was produced
USD/JPY Intraday: Support level at 143.890
Our pivot point is at 143.890
Preferable Price Action: Buy position above pivot with the target at 144.310 and 144.590 in extension.
Alternative Price Action: The downside breakout of the pivot would call for 143.560 and 143.310.
Comment: MACD is above 50 level and Pairs above 55MA.
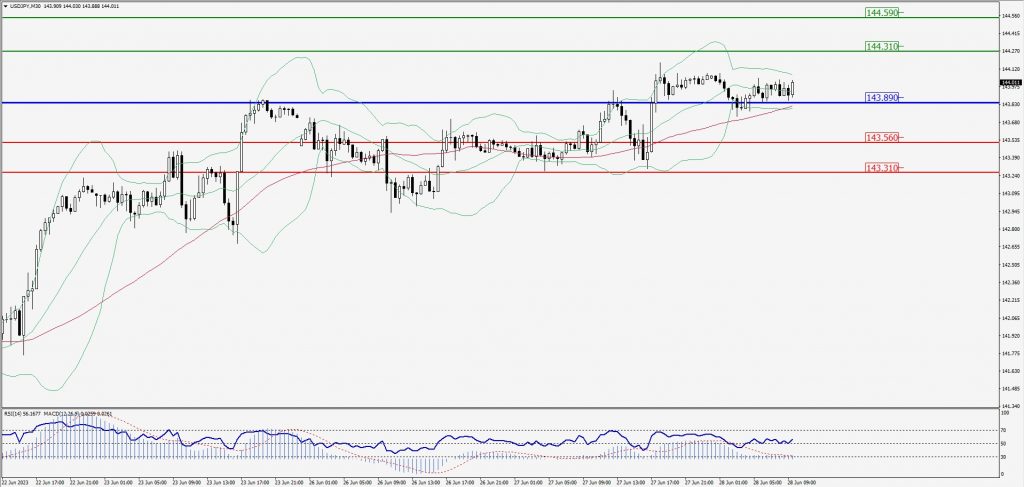
Green Lines Indicate Resistance Levels – Red Lines Indicate Support Levels
Light Blue is a Pivot Point – Black represents the price when the report was produced
AUD/USD Intraday: Major trend on the downside
Our pivot point is at 0.66520
Preferable Price Action: Sell positions below pivot with targets at 0.66230 & 0.66010 in extension.
Alternative Price Action: Above pivot looks for a further upside with 0.66790 & 0.67000 as targets.
Comment: RSI is below 50 levels and Pairs below its 20MA & 55MA.
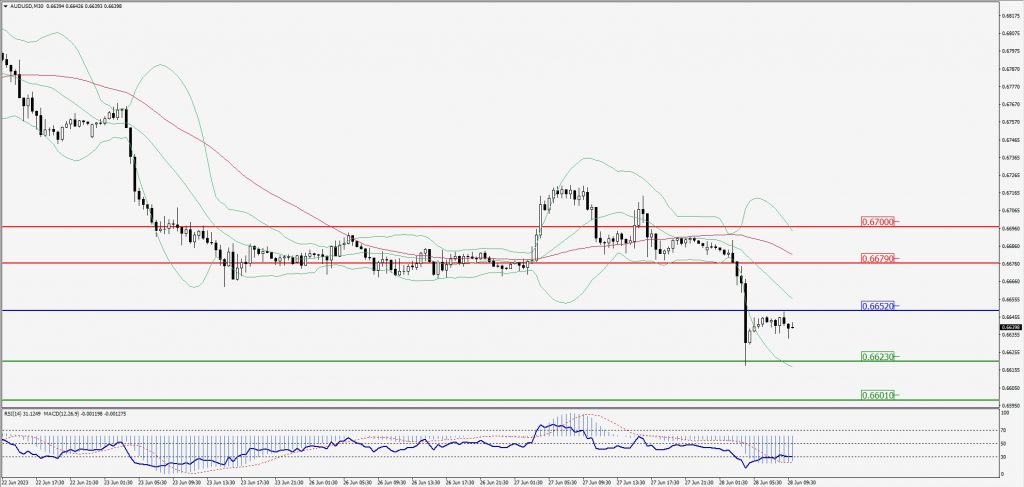
Green Lines Indicate Resistance Levels – Red Lines Indicate Support Levels
Light Blue is a Pivot Point – Black represents the price when the report was produced
CRUDEOIL Intraday: Trend on the downside
Our pivot point is at 68.42
Preferable Price Action: Below pivot sell oil with 67.25 & 66.41 as targets.
Alternative Price Action: Buy crude above pivot with targets at 69.42 and 70.21 in extension.
Comment: MACD is negative territory and Pairs below its 20MA & 55MA.
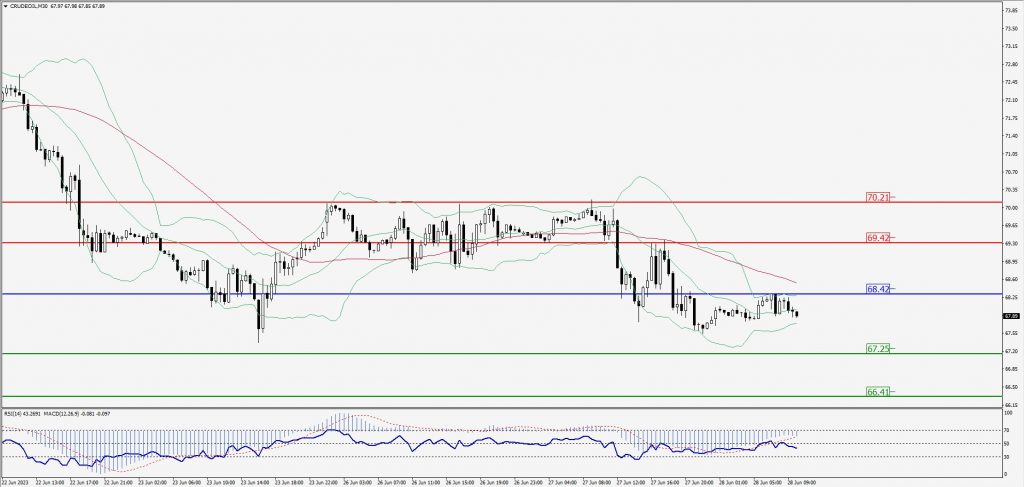
Green Lines Indicate Resistance Levels – Red Lines Indicate Support Levels
Light Blue is a Pivot Point – Black represents the price when the report was produced
XAU/USD Intraday: Trend on the downside
Our pivot point is 1914.10
Preferable Price Action: Further downside to 1907.80 and 1903.90.
Alternative Price Action: If the price gives an upside breakout of a pivot, then the price extends to 1919.40 and 1923.70.
Comment: MACD is below 50 level and Pairs below its 20MA & 55MA.
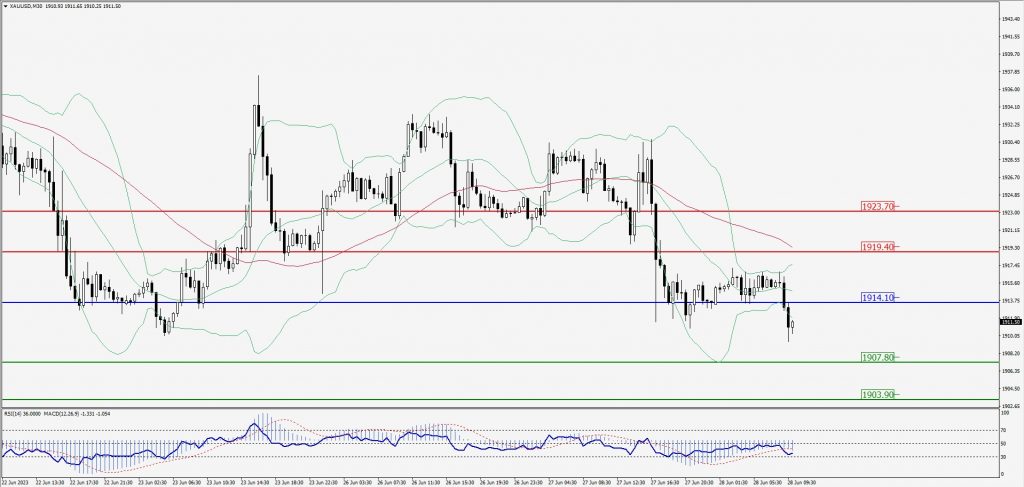
Green Lines Indicate Resistance Levels – Red Lines Indicate Support Levels
Light Blue is a Pivot Point – Black represents the price when the report was produced
Dow Jones Intraday: Trend on the upside
Our pivot point is 33,895.00
Preferable Price Action: Take buy positions above the pivot with targets at 33,971.00 & 34,020.00.
Alternative Price Action: Below 33,895.00 looks for further downside to 33,833.00 & 33,783.00.
Comment: RSI is above 50 levels and Pairs above 55MA.
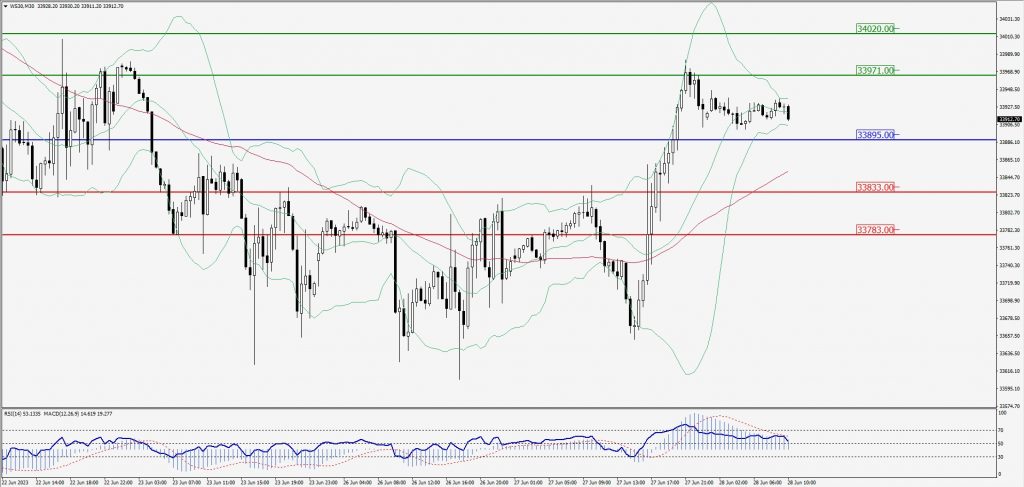
Green Lines Indicate Resistance Levels – Red Lines Indicate Support Levels
Light Blue is a Pivot Point – Black represents the price when the report was produced