Market Wrap: Stocks, Bonds, Commodities
US stock futures were roughly flat after the Federal Reserve skipped a rate hike at its meeting that ended Wednesday, but signaled two more rate hikes may still be in store later this year.
The Dow Jones Industrial Average fell 232.79 points to 33,979.33, the S&P 500 gain 0.08% to 4,372.59 and the Nasdaq Composite add 53.16 points to 13,626.48.
MSCI’s index of Asia-Pacific stocks outside Japan is advance 0.59% to 652.07 levels. The Australian index was higher by 0.19% to 7,175.30. Japanese Nikkei Index decline 0.05% today.
European stocks were negative on Thursday, with the Stoxx Europe 50 Index fell 0.22% to 4,366.15, Germany’s DAX decline 0.25% to 16,268.95, and France’s CAC drop 0.30% to 7,306.21 and U.K.’s FTSE 100 subtract 0.20% to 7,587.93.
Benchmark 10-year U.S. Treasury fell as demand for safe assets ascend again, today 10-year bond yields positive 1.01% to 3.8350.
Oil prices fell on Wednesday after the US Federal Reserve projected more interest rate hikes this year, worrying markets about demand just hours after government data showed an unexpected, large build in US crude oil stocks.
Spot Brent crude oil ascend 0.07% to $73.25 per barrel. US West Texas Intermediate crude is up 0.10% to $68.35 a barrel.
The yellow metal gold is decline 1.20% to 1,945.30 dollars per ounce.
Market Wrap: Forex
The U.S. dollar rallied in early European trade Thursday, boosted by the Federal Reserve’s hawkish projection of more tightening this year, while the euro weakened ahead of the latest European Central Bank policy meeting.
Today, the U.S. dollar index measures the Greenback against a trade-weighted basket of six major currencies, which surged 0.35% to 102.880.
The Euro US Dollar (EUR/USD) is a widely traded pair that is down 0.18% today. This left the pair trading around $1.08140.
The Japanese yen was negative against the U.S. dollar on Thursday. Today USD/JPY is surged 0.98% to the 141.470 level.
Another commodity-related currency mixed against the U.S dollar, AUD/USD rose 0.16% to 0.68070, and NZD/USD slipped 0.53% to 0.61740 level.
EUR/USD Intraday: Trend on the downside
Our pivot point is at 1.08220
Preferable Price Action: Take sell positions below pivot level with targets at 1.07880 & 1.07680 in extension.
Alternative Price Action: Above pivot looks for a further upside to 1.08480 & 1.08700.
Comment: RSI is below 50 levels and Pairs below its 20MA & 55MA.
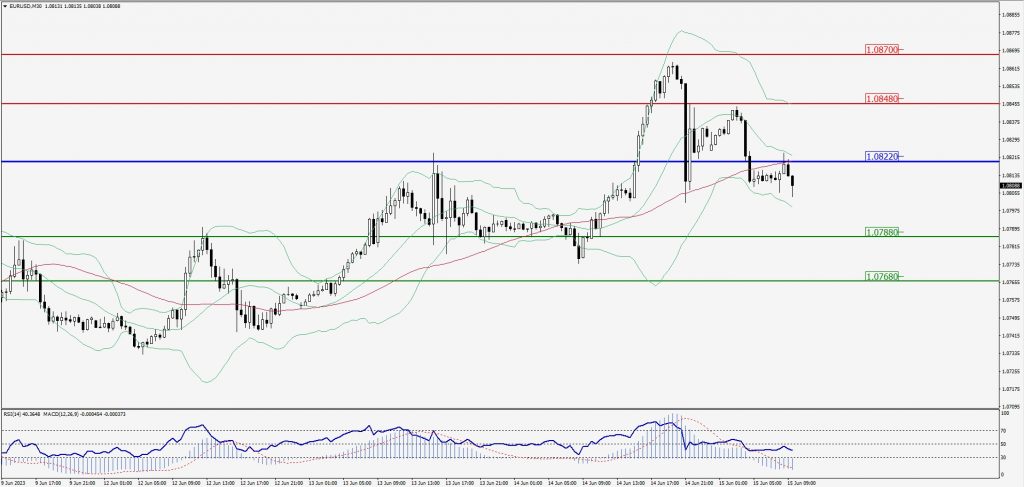
Green Lines Indicate Resistance Levels – Red Lines Indicate Support Levels
Light Blue is a Pivot Point – Black represents the price when the report was produced
GBP/USD Intraday: In a consolidation zone
Our pivot point is at 1.26680
Preferable Price Action: Sell positions below pivot with targets at 1.26140 & 1.25800 in extension.
Alternative Price Action: The price above pivot would call for further upside to 1.27160 & 1.27490.
Comment: RSI is at 50 levels.
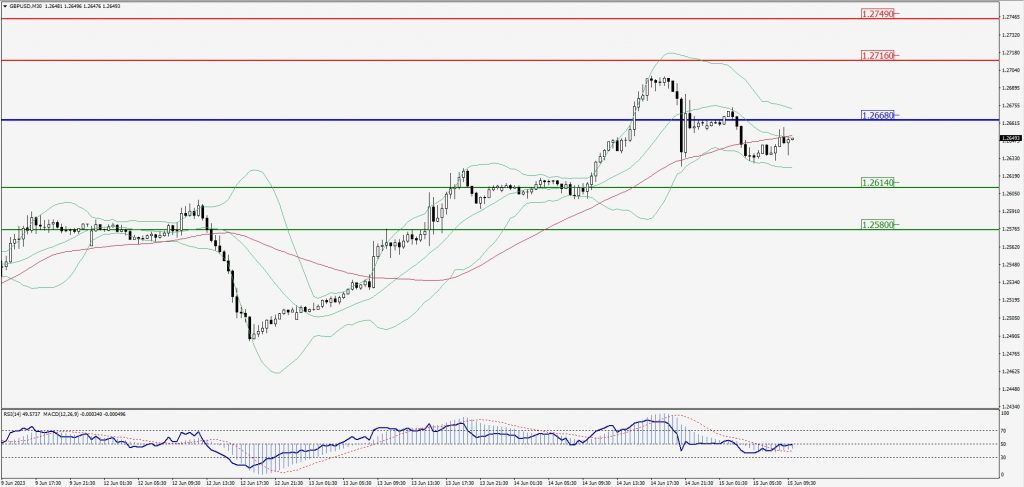
Green Lines Indicate Resistance Levels – Red Lines Indicate Support Levels
Light Blue is a Pivot Point – Black represents the price when the report was produced
USD/JPY Intraday: Major trend on the upside
Our pivot point is at 141.160
Preferable Price Action: Buy position above pivot with the target at 141.830 and 142.220 in extension.
Alternative Price Action: The downside breakout of the pivot would call for 140.550 and 140.150.
Comment: MACD is above 50 level and Pairs above its 20MA & 55MA.
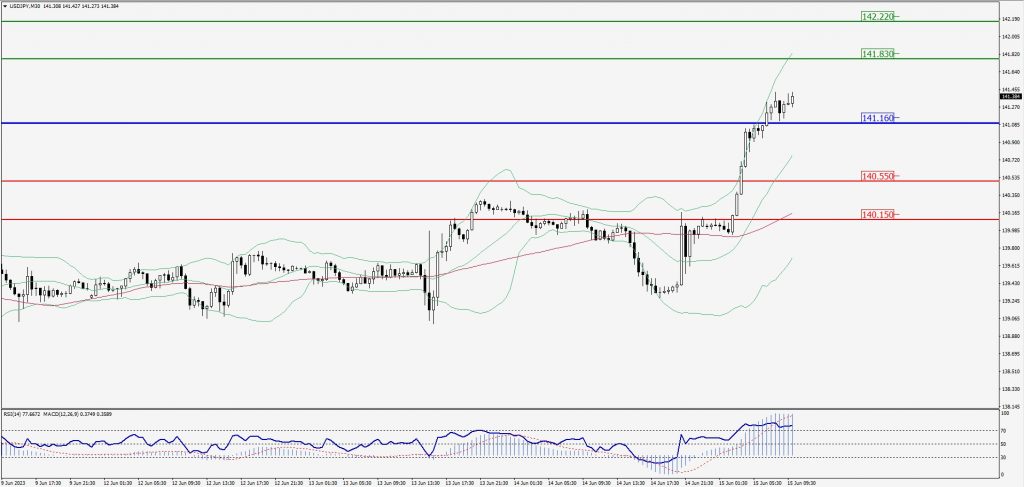
Green Lines Indicate Resistance Levels – Red Lines Indicate Support Levels
Light Blue is a Pivot Point – Black represents the price when the report was produced
AUD/USD Intraday: In a consolidation zone
Our pivot point is at 0.67970
Preferable Price Action: Buy positions above pivot with targets at 0.68260 & 0.68470 in extension.
Alternative Price Action: Below pivot looks for a further downside with 0.67710 & 0.67490 as targets.
Comment: RSI is at 50 levels and Pairs above 55MA.
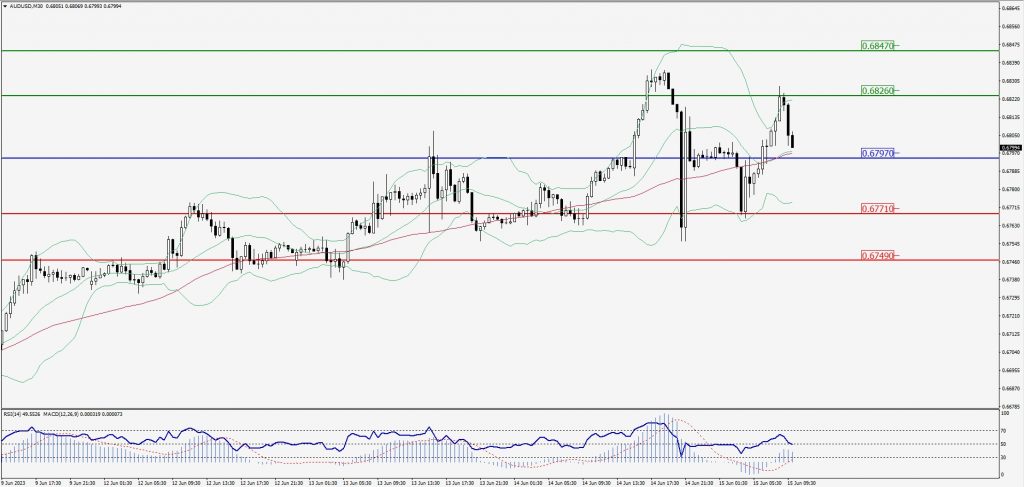
Green Lines Indicate Resistance Levels – Red Lines Indicate Support Levels
Light Blue is a Pivot Point – Black represents the price when the report was produced
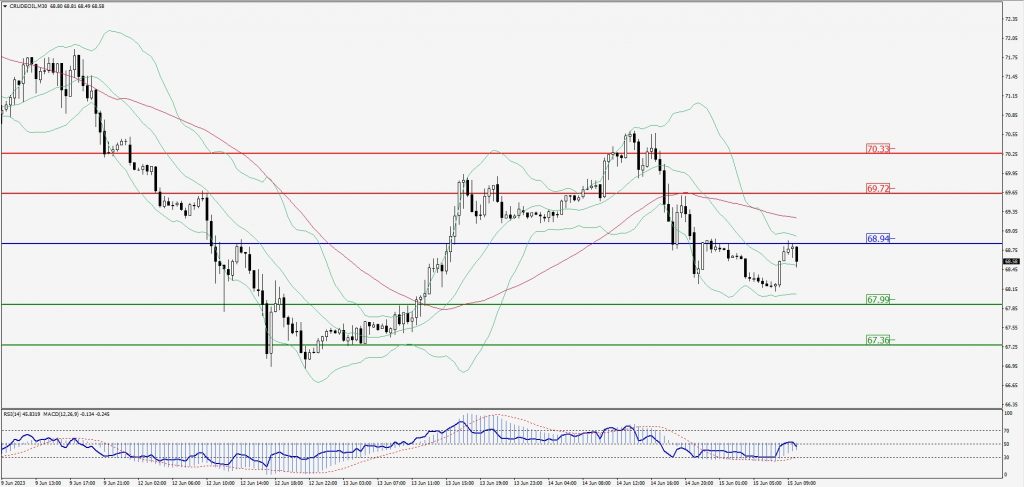
CRUDEOIL Intraday: Trend on the downside
Our pivot point is at 68.94
Preferable Price Action: Below pivot sell oil with 67.99 & 67.36 as targets.
Alternative Price Action: Buy crude above pivot with targets at 69.72 and 70.33 in extension.
Comment: MACD is negative territory and Pairs below 55MA.
Green Lines Indicate Resistance Levels – Red Lines Indicate Support Levels
Light Blue is a Pivot Point – Black represents the price when the report was produced
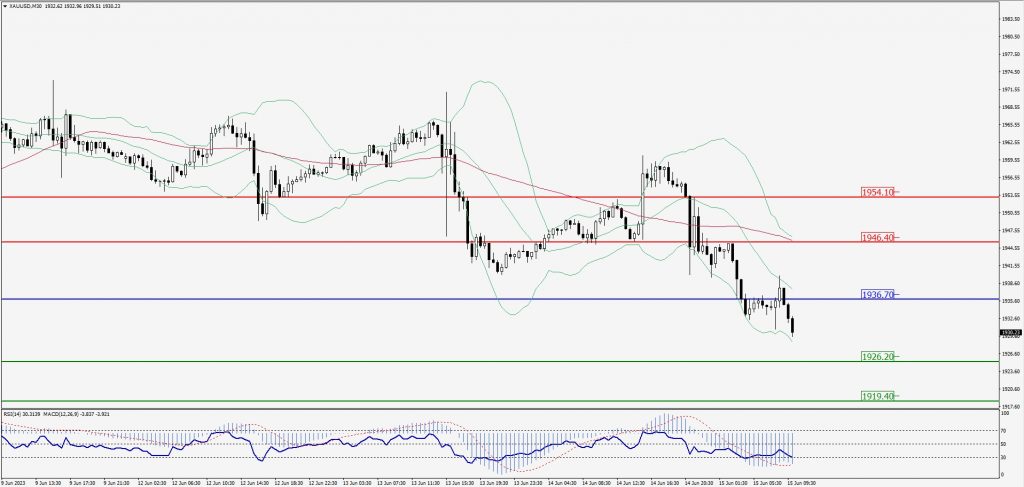
XAU/USD Intraday: Major trend on the downside
Our pivot point is 1936.70
Preferable Price Action: Further downside to 1926.20 and 1919.40
Alternative Price Action: If the price gives an upside breakout of a pivot, then the price extends to 1946.40 and 1954.10.
Comment: MACD is below 50 level and Pairs below its 20MA & 55MA.
Green Lines Indicate Resistance Levels – Red Lines Indicate Support Levels
Light Blue is a Pivot Point – Black represents the price when the report was produced
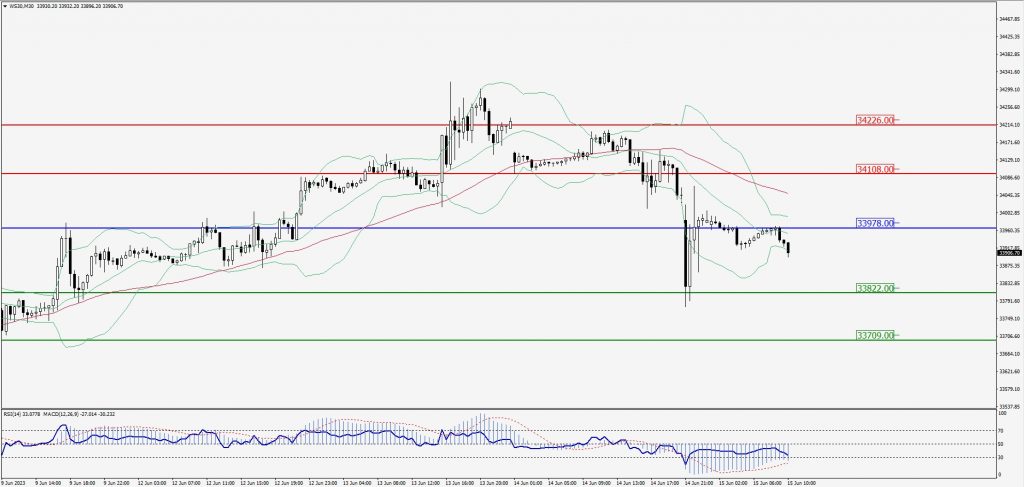
Dow Jones Intraday: Trend on the downside
Our pivot point is 33,978.00
Preferable Price Action: Take sell positions below the pivot with targets at 33,822.00 & 33,709.00.
Alternative Price Action: Above 33,978.00 looks for further upside to 34,108.00 & 34,226.00.
Comment: RSI is below 50 levels and Pairs below its 20MA & 55MA.
Green Lines Indicate Resistance Levels – Red Lines Indicate Support Levels
Light Blue is a Pivot Point – Black represents the price when the report was produced