Market Wrap: Stocks, Bonds, Commodities
Stocks rose Tuesday night after new inflation data showed price pressures slowed again in May, adding to investor optimism that the Federal Reserve could skip a rate hike when it next decides on policy this week.
The Dow Jones Industrial Average rose 145.79 points to 34,212.12, the S&P 500 gain 0.69% to 4,369.01 and the Nasdaq Composite add 111.40 points to 13,573.32.
MSCI’s index of Asia-Pacific stocks outside Japan is advance 0.42% to 646.76 levels. The Australian index was higher by 0.32% to 7,161.70. Japanese Nikkei Index advance 1.47% today.
European stocks were positive on Wednesday, with the Stoxx Europe 50 Index rose 0.23% to 4,357.65, Germany’s DAX advance 0.15% to 16,255.95, and France’s CAC ascend 0.31% to 7,313.27 and U.K.’s FTSE 100 add 0.06% to 7,599.61.
Benchmark 10-year U.S. Treasury fell as demand for safe assets ascend again, today 10-year bond yields negative 1.18% to 3.7970.
Oil prices climbed 3 percent on Tuesday, recovering from steep losses the previous session, after China’s central bank lowered a short-term lending rate for the first time in 10 months.
Spot Brent crude oil ascend 0.23% to $74.46 per barrel. US West Texas Intermediate crude is up 0.07% to $69.49 a barrel.
The yellow metal gold is advance 0.25% to 1,963.35 dollars per ounce.
Market Wrap: Forex
The U.S. dollar edged lower in early European trade Wednesday, struggling for traction ahead of the conclusion of the latest Federal Reserve policy meeting.
Today, the U.S. dollar index measures the Greenback against a trade-weighted basket of six major currencies, which slipped 0.12% to 102.800.
The Euro US Dollar (EUR/USD) is a widely traded pair that is up 0.01% today. This left the pair trading around $1.07940.
The Japanese yen was negative against the U.S. dollar on Wednesday. Today USD/JPY is slipped 0.20% to the 139.940 level.
Another commodity-related currency positive against the U.S dollar, AUD/USD rose 0.19% to 0.67790, and NZD/USD surged 0.15% to 0.61590 level.
EUR/USD Intraday: Resistance level at 1.07940
Our pivot point is at 1.07940
Preferable Price Action: Take sell positions below pivot level with targets at 1.07690 & 1.07530 in extension.
Alternative Price Action: Above pivot looks for a further upside to 1.08180 & 1.08350.
Comment: RSI is below 50 levels and Pairs below its 20MA & 55MA.
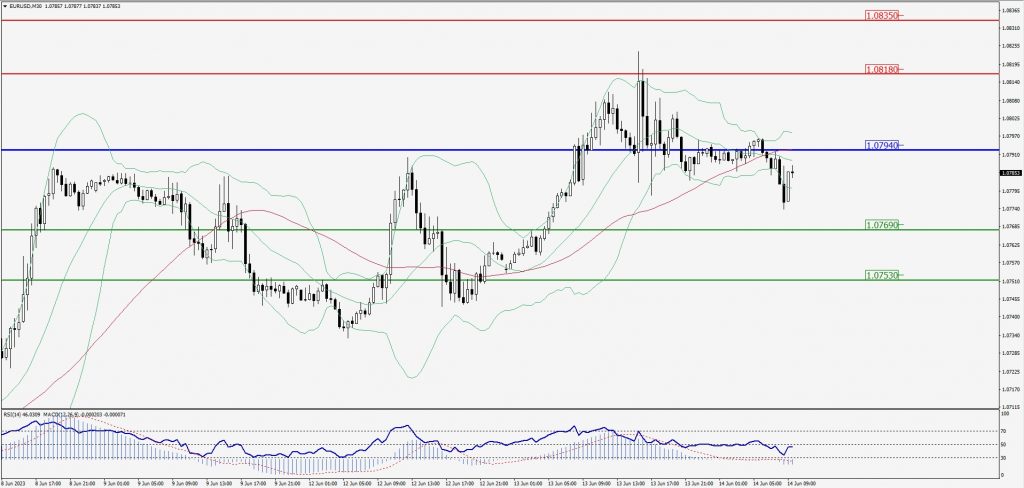
Green Lines Indicate Resistance Levels – Red Lines Indicate Support Levels
Light Blue is a Pivot Point – Black represents the price when the report was produced
GBP/USD Intraday: Trend on the upside
Our pivot point is at 1.25970
Preferable Price Action: Buy positions above pivot with targets at 1.26390 & 1.26690 in extension.
Alternative Price Action: The price below pivot would call for further downside to 1.25630 & 1.25350.
Comment: RSI is above 50 levels and Pairs above 55MA.
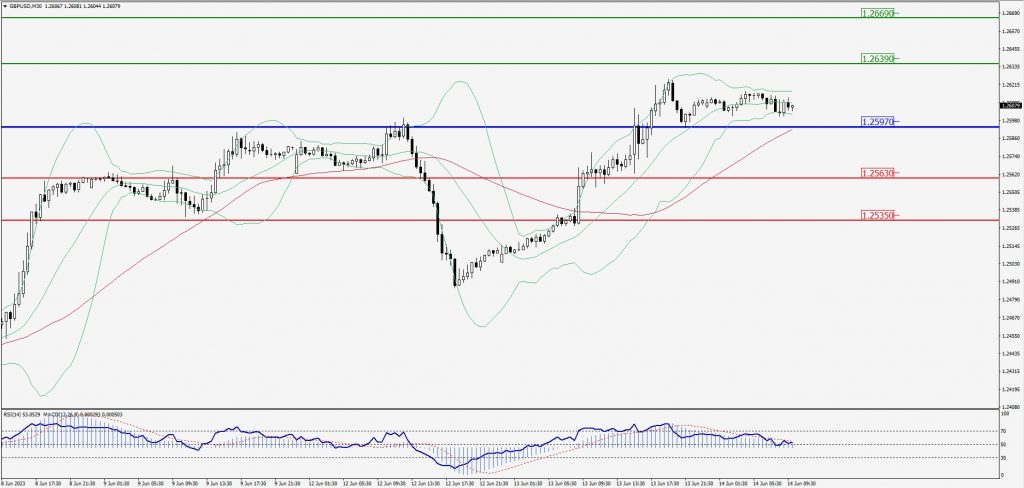
Green Lines Indicate Resistance Levels – Red Lines Indicate Support Levels
Light Blue is a Pivot Point – Black represents the price when the report was produced
USD/JPY Intraday: Trend on the upside
Our pivot point is at 140.040
Preferable Price Action: Buy position above pivot with the target at 140.370 and 140.590 in extension.
Alternative Price Action: The downside breakout of the pivot would call for 139.750 and 139.530.
Comment: MACD is above 50 level and Pairs above its 55MA.
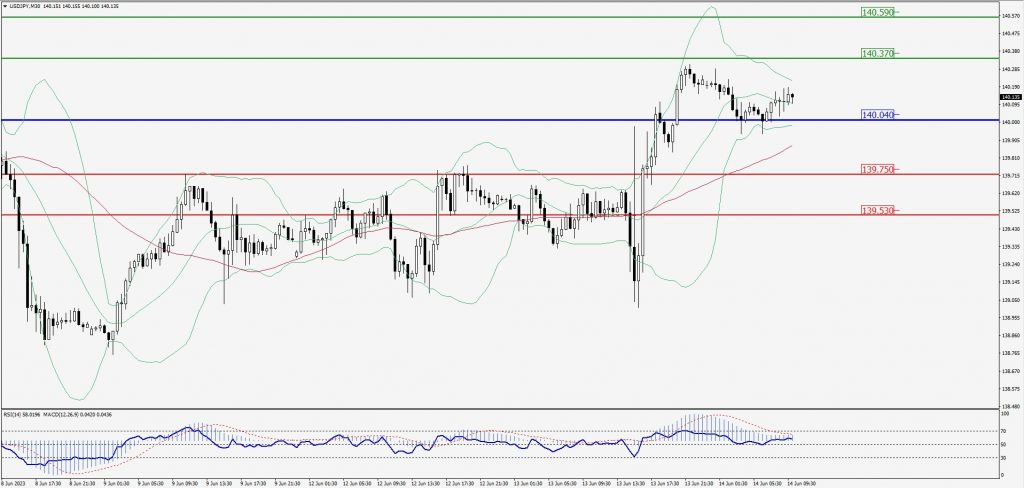
Green Lines Indicate Resistance Levels – Red Lines Indicate Support Levels
Light Blue is a Pivot Point – Black represents the price when the report was produced
AUD/USD Intraday: In a consolidation zone
Our pivot point is at 0.67750
Preferable Price Action: Sell positions below pivot with targets at 0.67510 & 0.67320 in extension.
Alternative Price Action: Above pivot looks for a further upside with 0.68000 & 0.68190 as targets.
Comment: RSI is at 50 levels and Pairs below 55MA.
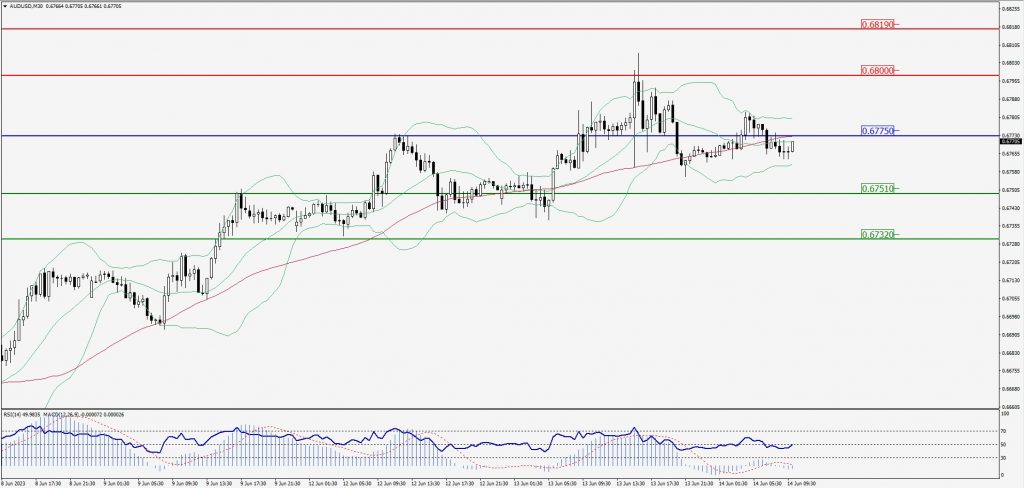
Green Lines Indicate Resistance Levels – Red Lines Indicate Support Levels
Light Blue is a Pivot Point – Black represents the price when the report was produced
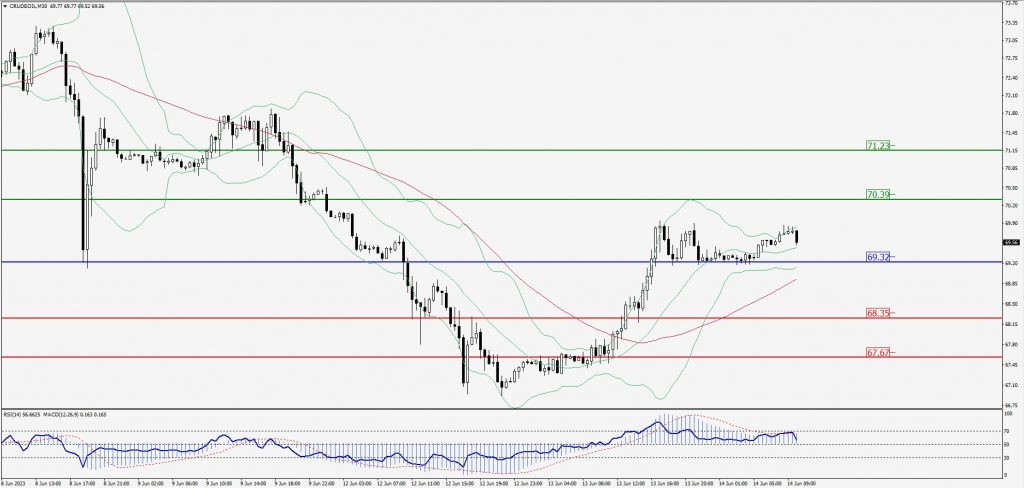
CRUDEOIL Intraday: Support level at 69.32
Our pivot point is at 69.32
Preferable Price Action: Above pivot buy oil with 70.39 & 71.23 as targets.
Alternative Price Action: Sell crude below pivot with targets at 68.35 and 67.67 in extension.
Comment: MACD is positive territory and Pairs above 55MA.
Green Lines Indicate Resistance Levels – Red Lines Indicate Support Levels
Light Blue is a Pivot Point – Black represents the price when the report was produced
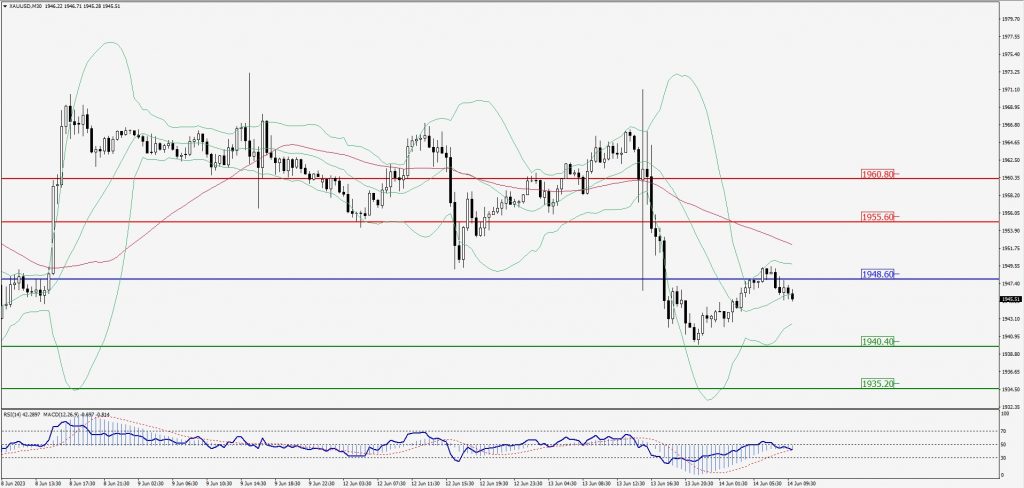
XAU/USD Intraday: Trend on the downside
Our pivot point is 1948.60
Preferable Price Action: Further downside to 1940.40 and 1935.20
Alternative Price Action: If the price gives an upside breakout of a pivot, then the price extends to 1955.60 and 1960.80.
Comment: MACD is below 50 level and Pairs below 55MA.
Green Lines Indicate Resistance Levels – Red Lines Indicate Support Levels
Light Blue is a Pivot Point – Black represents the price when the report was produced
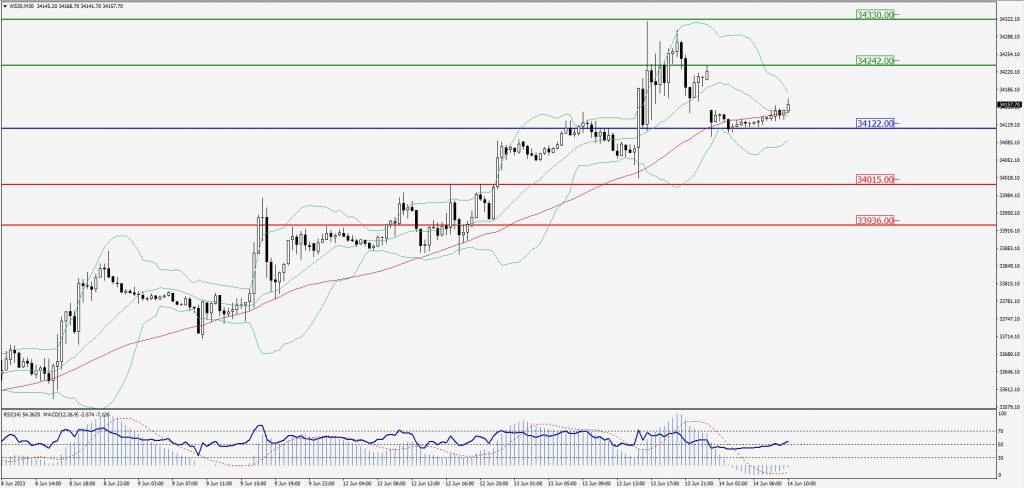
Dow Jones Intraday: Support level at 34,122.00
Our pivot point is 34,122.00
Preferable Price Action: Take buy positions above the pivot with targets at 34,242.00 & 34,330.00.
Alternative Price Action: Below 34,122.00 looks for further downside to 34,015.00 & 33,936.00.
Comment: RSI is above 50 levels and Pairs above its 20MA & 55MA.
Green Lines Indicate Resistance Levels – Red Lines Indicate Support Levels
Light Blue is a Pivot Point – Black represents the price when the report was produced