Market Wrap: Stocks, Bonds, Commodities
Stock futures were modestly higher on Monday after a key debt ceiling meeting between President Joe Biden and House Speaker Kevin McCarthy, even though the two did not strike a deal.
The Dow Jones Industrial Average fell 140.05 points to 33,286.58, the S&P 500 gain 0.02% to 4,192.63 and the Nasdaq Composite add 62.88 points to 12,720.78.
MSCI’s index of Asia-Pacific stocks outside Japan is decline 0.42% to 630.46 levels. The Australian index was lower by 0.05% to 7,259.90. Japanese Nikkei Index decline 0.42% today.
European stocks were negative on Tuesday, with the Stoxx Europe 50 Index fell 0.56% to 4,361.05, Germany’s DAX decline 0.14% to 16,202.75, and France’s CAC drop 1.03% to 7,400.79 and U.K.’s FTSE 100 add 0.05% to 7,773.60.
Benchmark 10-year U.S. Treasury fell as demand for safe assets ascend again, today 10-year bond yields positive 0.24% to 3.7230.
Oil prices traded either side of unchanged on Monday as the market waited for news on the US debt ceiling talks and as a stronger dollar offset support from lower supplies from Canada and OPEC+ producers.
Spot Brent crude oil drop 0.09% to $75.92 per barrel. US West Texas Intermediate crude is down 0.10% to $71.98 a barrel.
The yellow metal gold is decline 0.79% to 1,961.60 dollars per ounce.
Market Wrap: Forex
The U.S. dollar inched higher for a second day on Tuesday – touching a six-month peak against Japan’s yen – on expectations that U.S. rates will remain higher for longer, while ongoing debt ceiling negotiations kept investors on edge.
Today, the U.S. dollar index measures the Greenback against a trade-weighted basket of six major currencies, which surged 0.15% to 103.230.
The Euro US Dollar (EUR/USD) is a widely traded pair that is down 0.14% today. This left the pair trading around $1.07990.
The Japanese yen was negative against the U.S. dollar on Tuesday. Today USD/JPY is slipped 0.22% to the 138.300 level.
Another commodity-related currency negative against the U.S dollar, AUD/USD fell 0.36% to 0.66280, and NZD/USD slipped 0.37% to 0.62650 level.
EUR/USD Intraday: Resistance level at 1.08120
Our pivot point is at 1.08120
Preferable Price Action: Take sell positions below pivot level with targets at 1.07940 & 1.07790 in extension.
Alternative Price Action: Above pivot looks for a further upside to 1.08300 & 1.08430.
Comment: RSI is below 50 levels and Pairs below its 20MA & 55MA.
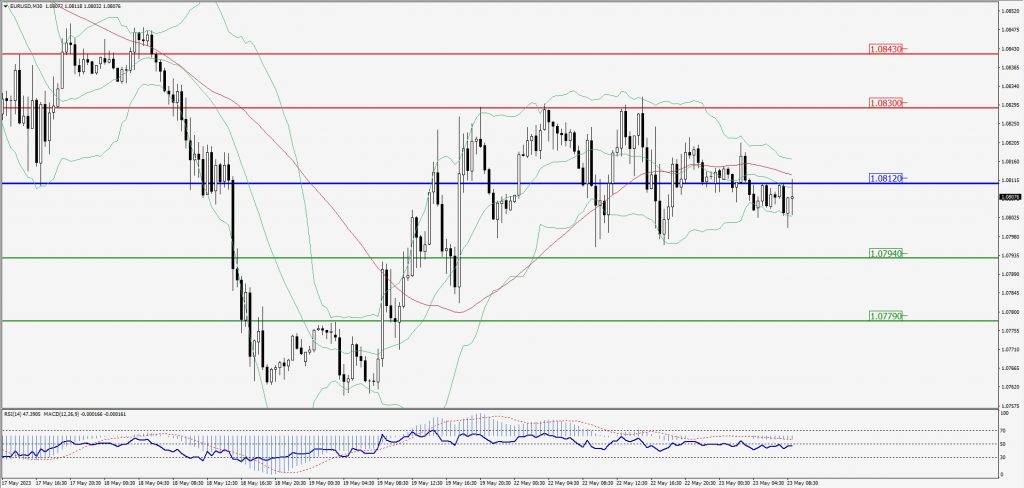
Green Lines Indicate Resistance Levels – Red Lines Indicate Support Levels
Light Blue is a Pivot Point – Black represents the price when the report was produced
GBP/USD Intraday: Trend on the downside
Our pivot point is at 1.24390
Preferable Price Action: Sell positions below pivot with targets at 1.24030 & 1.23810 in extension.
Alternative Price Action: The price above pivot would call for further upside to 1.24740 & 1.24980.
Comment: RSI is below 50 levels and Pairs below its 20MA & 55MA.
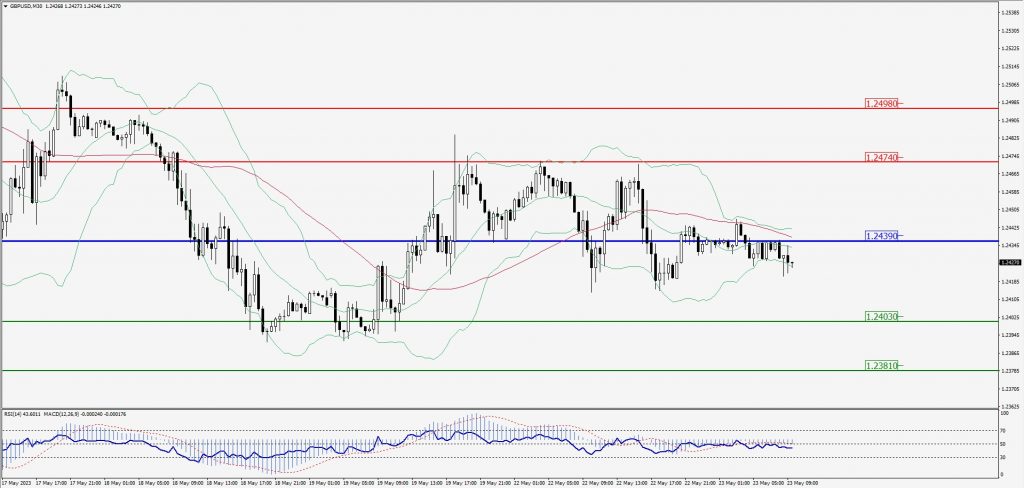
Green Lines Indicate Resistance Levels – Red Lines Indicate Support Levels
Light Blue is a Pivot Point – Black represents the price when the report was produced
USD/JPY Intraday: In a consolidation zone
Our pivot point is at 138.700
Preferable Price Action: Sell position below pivot with the target at 138.130 and 137.790 in extension.
Alternative Price Action: The upside breakout of the pivot would call for 139.170 and 139.550.
Comment: MACD is below 50 level and Pairs below 20MA.
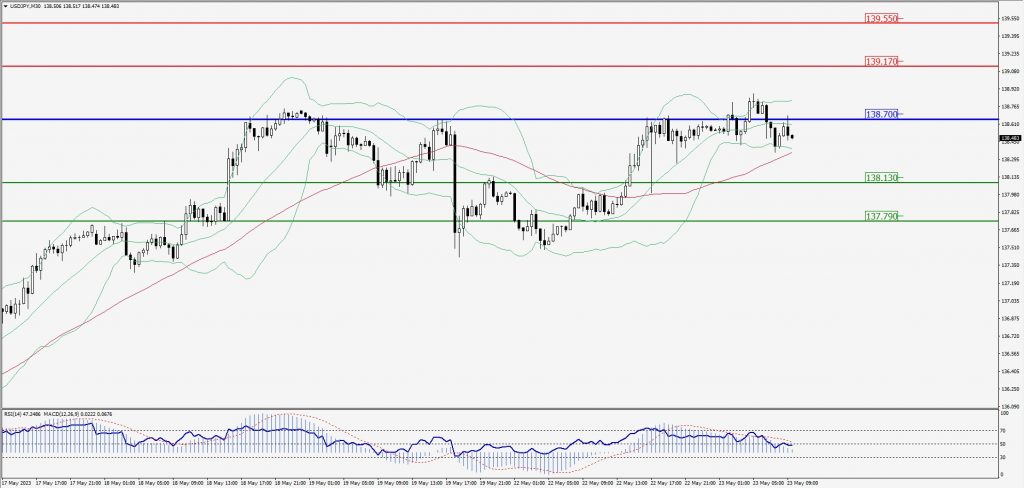
Green Lines Indicate Resistance Levels – Red Lines Indicate Support Levels
Light Blue is a Pivot Point – Black represents the price when the report was produced
AUD/USD Intraday: Support level at 0.66500
Our pivot point is at 0.66500
Preferable Price Action: Buy positions above pivot with targets at 0.66690 & 0.66820 in extension.
Alternative Price Action: Below pivot looks for a further downside with 0.66330 & 0.66200 as targets.
Comment: RSI is above 50 levels and Pairs above its 20MA & 55MA.
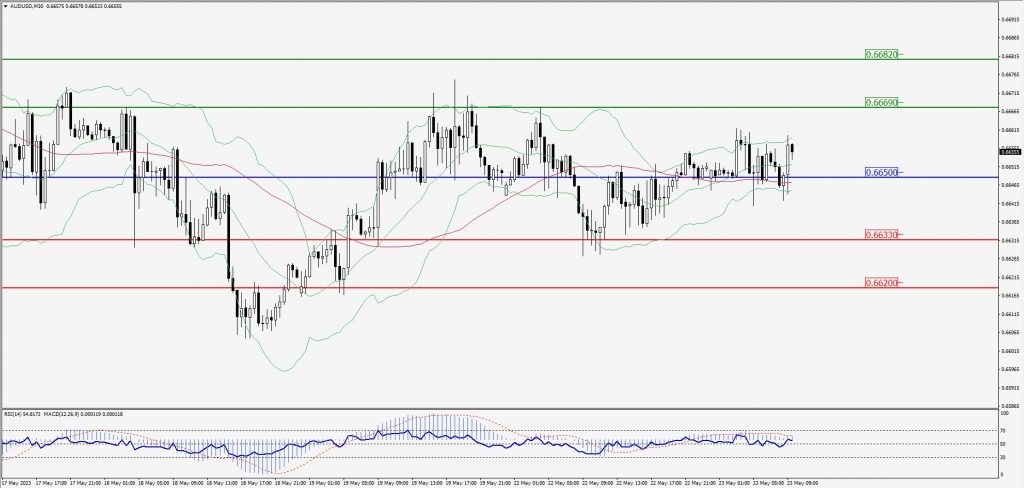
Green Lines Indicate Resistance Levels – Red Lines Indicate Support Levels
Light Blue is a Pivot Point – Black represents the price when the report was produced
CRUDEOIL Intraday: Trend on the upside
Our pivot point is at 72.10
Preferable Price Action: Above pivot buy oil with 72.94 & 73.60 as targets.
Alternative Price Action: Sell crude below pivot with targets at 71.36 and 70.80 in extension.
Comment: MACD is positive territory and Pairs above its 20MA & 55MA.
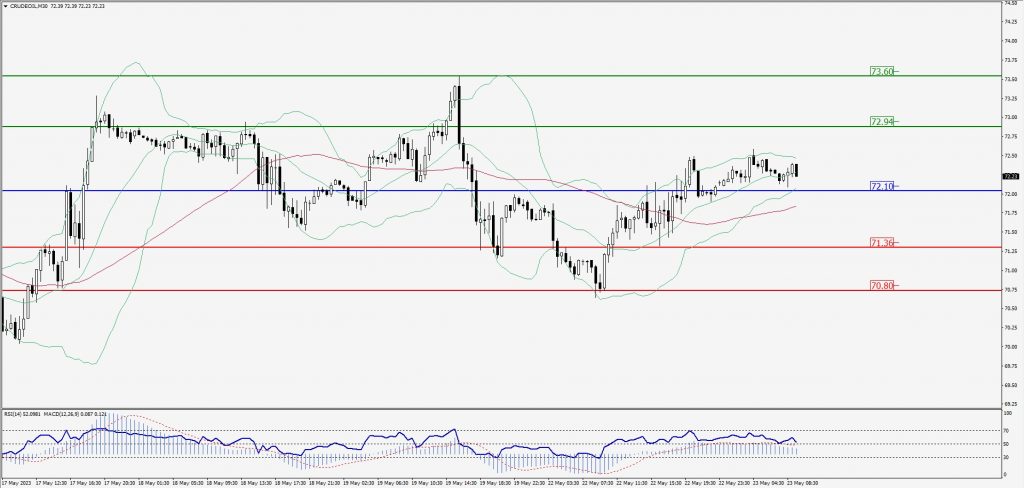
Green Lines Indicate Resistance Levels – Red Lines Indicate Support Levels
Light Blue is a Pivot Point – Black represents the price when the report was produced
XAU/USD Intraday: Trend on the downside
Our pivot point is 1964.90
Preferable Price Action: Further downside to 1956.40 and 1951.10
Alternative Price Action: If the price gives an upside breakout of a pivot, then the price extends to 1972.30 and 1978.90.
Comment: MACD is below 50 level and Pairs below its 20MA & 55MA.
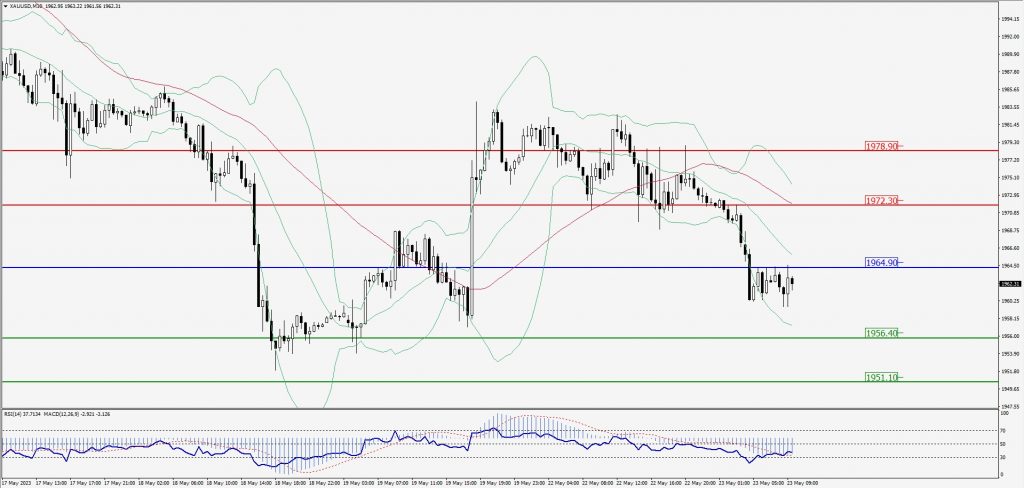
Green Lines Indicate Resistance Levels – Red Lines Indicate Support Levels
Light Blue is a Pivot Point – Black represents the price when the report was produced
Dow Jones Intraday: Trend on the downside
Our pivot point is 33,377.00
Preferable Price Action: Take sell positions below the pivot with targets at 33,236.00 & 33,143.00.
Alternative Price Action: Above 33,377.00 looks for further upside to 33,500.00 & 33,618.00.
Comment: RSI is below 50 levels and Pairs below its 20MA & 55MA.
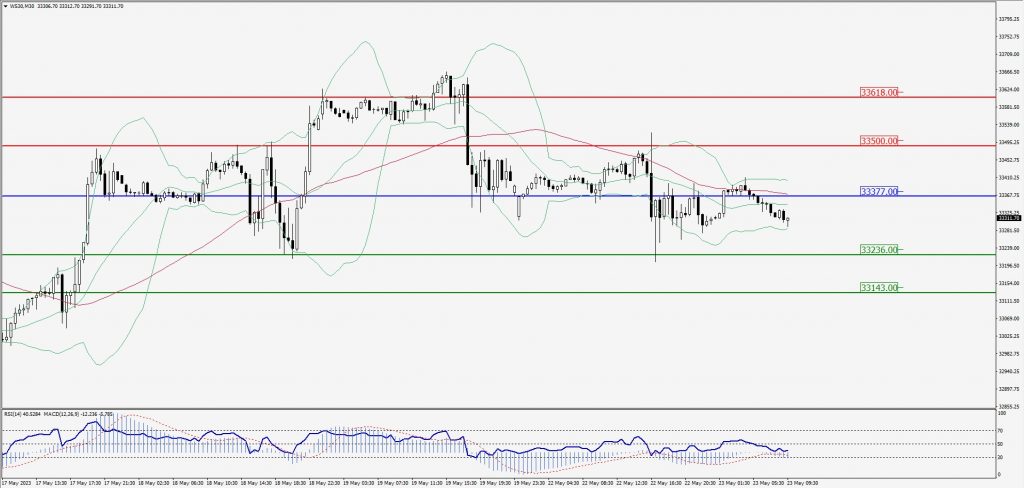
Green Lines Indicate Resistance Levels – Red Lines Indicate Support Levels
Light Blue is a Pivot Point – Black represents the price when the report was produced