Market Wrap: Stocks, Bonds, Commodities
The S&P 500 and Nasdaq Composite jumped on Thursday to notch their highest closing levels since August 2022 as Wall Street traders kept focused on debt ceiling negotiations.
The Dow Jones Industrial Average rose 115.14 points to 33,535.91, the S&P 500 gain 0.94% to 4,198.05 and the Nasdaq Composite add 188.27 points to 12,688.84.
MSCI’s index of Asia-Pacific stocks outside Japan is decline 0.04% to 628.68 levels. The Australian index was higher by 0.59% to 7,279.50. Japanese Nikkei Index advance 0.77% today.
European stocks were positive on Friday, with the Stoxx Europe 50 Index rose 0.72% to 4,399.05, Germany’s DAX advance 0.59% to 16,259.85, and France’s CAC ascend 0.59% to 7,491.26 and U.K.’s FTSE 100 add 0.41% to 7,774.31.
Benchmark 10-year U.S. Treasury fell as demand for safe assets ascend again, today 10-year bond yields negative 0.52% to 3.6370.
Oil prices dipped on Thursday as traders warily watched for signs of progress on talks to raise the U.S. debt ceiling, after surging in the previous session on optimism over U.S. fuel demand.
Spot Brent crude oil ascend 0.87% to $76.51 per barrel. US West Texas Intermediate crude is up 0.74% to $72.39 a barrel.
The yellow metal gold is advance 0.39% to 1,967.35 dollars per ounce.
Market Wrap: Forex
The U.S. dollar edged lower in early European trade Friday, but remained near a two-month high as strong labor data and optimism that a U.S. debt default can be avoided pointed to the Federal Reserve retaining a tight monetary policy for longer.
Today, the U.S. dollar index measures the Greenback against a trade-weighted basket of six major currencies, which slipped 0.23% to 103.210.
The Euro US Dollar (EUR/USD) is a widely traded pair that is up 0.20% today. This left the pair trading around $1.07910.
The Japanese yen was negative against the U.S. dollar on Friday. Today USD/JPY is slipped 0.38% to the 138.170 level.
Another commodity-related currency positive against the U.S dollar, AUD/USD rose 0.44% to 0.66510, and NZD/USD surged 0.71% to 0.62700 level.
EUR/USD Intraday: Trend on the upside
Our pivot point is at 1.07720
Preferable Price Action: Take buy positions above pivot level with targets at 1.08100 & 1.08350 in extension.
Alternative Price Action: Below pivot looks for a further downside to 1.07430 & 1.07150.
Comment: RSI is above 50 levels and Pairs above 20MA.
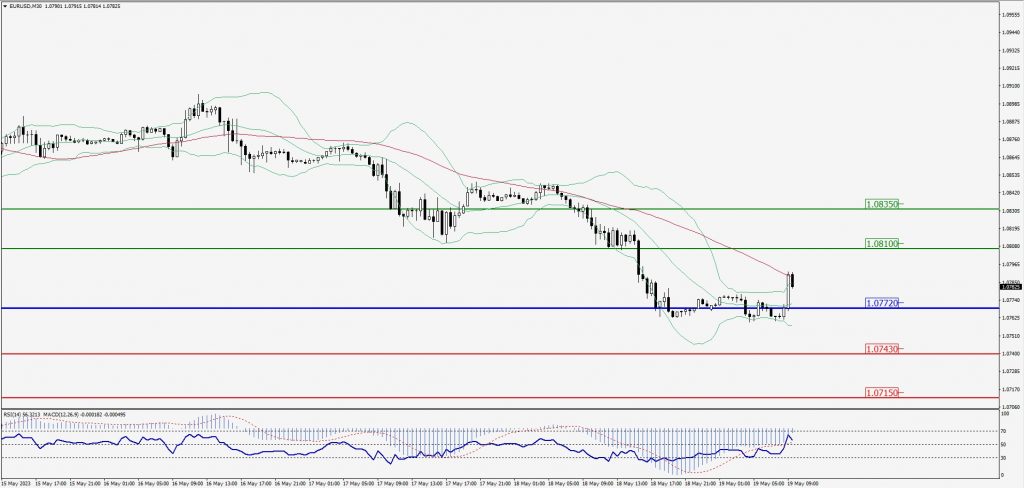
Green Lines Indicate Resistance Levels – Red Lines Indicate Support Levels
Light Blue is a Pivot Point – Black represents the price when the report was produced
GBP/USD Intraday: Trend on the upside
Our pivot point is at 1.24030
Preferable Price Action: Buy positions above pivot with targets at 1.24410 & 1.24690 in extension.
Alternative Price Action: The price below pivot would call for further downside to 1.23700 & 1.23420.
Comment: RSI is above 50 levels and Pairs above 20MA.
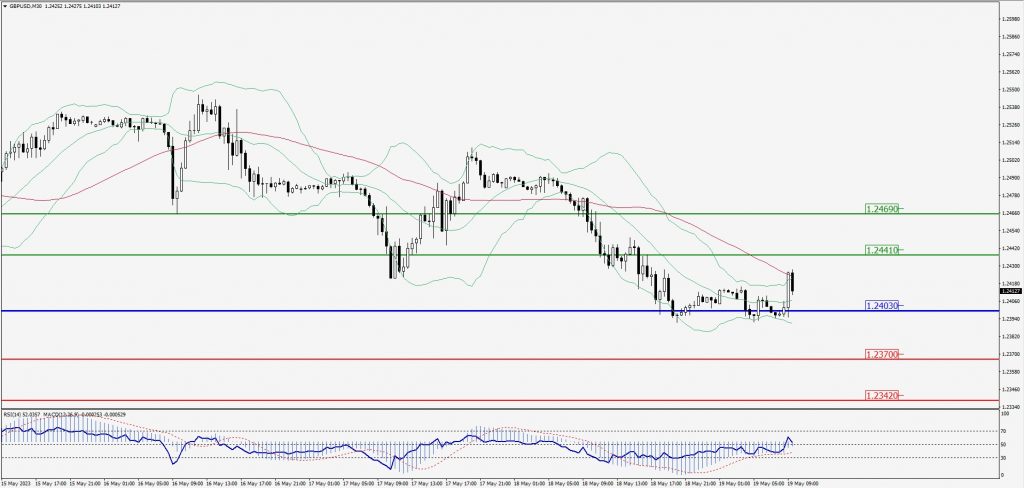
Green Lines Indicate Resistance Levels – Red Lines Indicate Support Levels
Light Blue is a Pivot Point – Black represents the price when the report was produced
USD/JPY Intraday: Trend on the downside
Our pivot point is at 138.440
Preferable Price Action: Sell position below pivot with the target at 137.800 and 137.370 in extension.
Alternative Price Action: The upside breakout of the pivot would call for 138.920 and 139.300.
Comment: MACD is below 50 level and Pairs below 20MA.
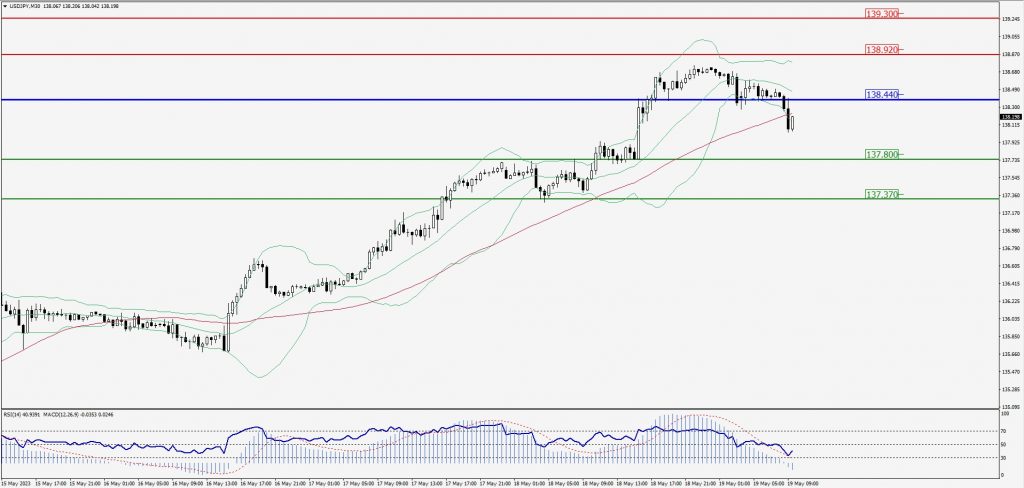
Green Lines Indicate Resistance Levels – Red Lines Indicate Support Levels
Light Blue is a Pivot Point – Black represents the price when the report was produced
AUD/USD Intraday: Trend on the upside
Our pivot point is at 0.66390
Preferable Price Action: Buy positions above pivot with targets at 0.66660 & 0.66820 in extension.
Alternative Price Action: Below pivot looks for a further downside with 0.66110 & 0.65910 as targets.
Comment: RSI is above 50 levels and Pairs above its 20MA & 55MA.
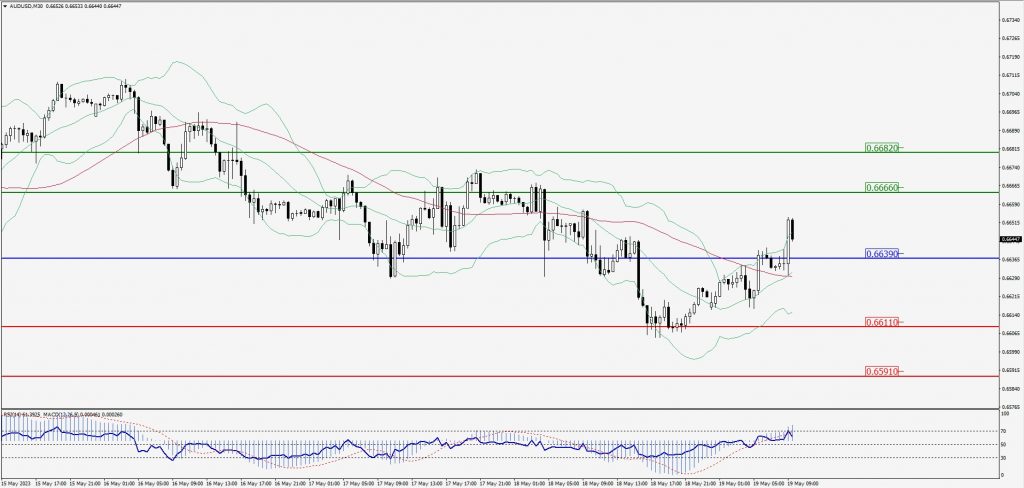
Green Lines Indicate Resistance Levels – Red Lines Indicate Support Levels
Light Blue is a Pivot Point – Black represents the price when the report was produced
CRUDEOIL Intraday: Support level at 72.47
Our pivot point is at 72.47
Preferable Price Action: Above pivot buy oil with 73.25 & 73.81 as targets.
Alternative Price Action: Sell crude below pivot with targets at 71.79 and 71.28 in extension.
Comment: MACD is positive territory and Pairs above its 20MA & 55MA.
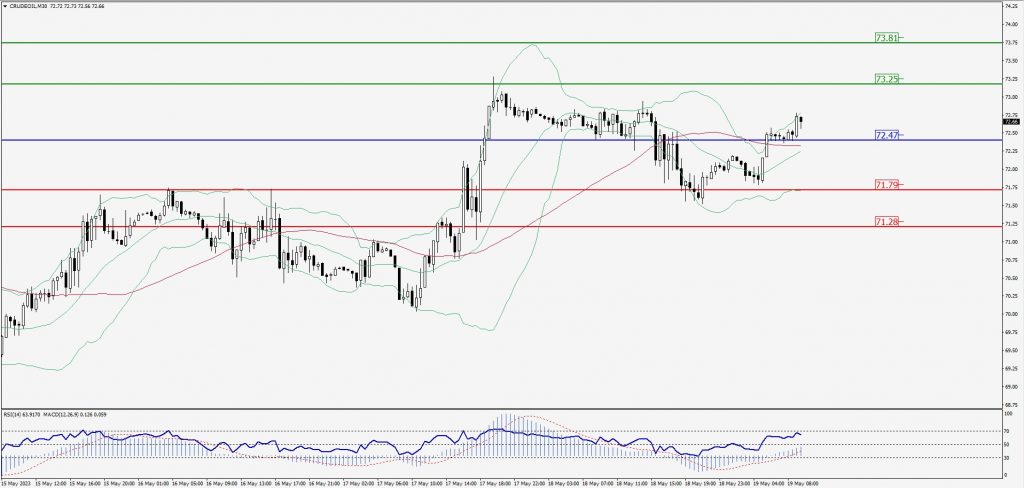
Green Lines Indicate Resistance Levels – Red Lines Indicate Support Levels
Light Blue is a Pivot Point – Black represents the price when the report was produced
XAU/USD Intraday: Trend on the upside
Our pivot point is 1960.50
Preferable Price Action: Further upside to 1979.00 and 1991.30
Alternative Price Action: If the price gives a downside breakout of a pivot, then the price extends to 1946.00 and 1934.90.
Comment: MACD is above 50 level and Pairs below 20MA.
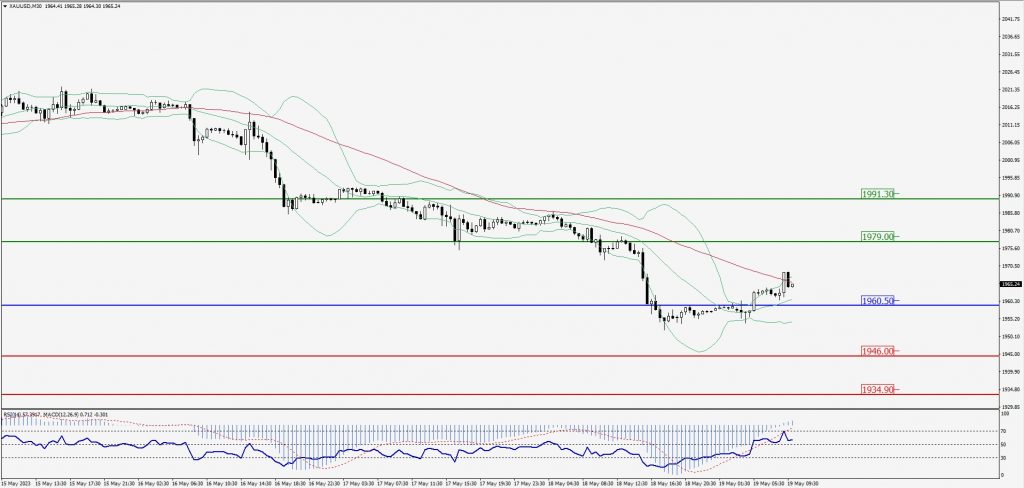
Green Lines Indicate Resistance Levels – Red Lines Indicate Support Levels
Light Blue is a Pivot Point – Black represents the price when the report was produced
Dow Jones Intraday: Trend on the upside
Our pivot point is 33,526.00
Preferable Price Action: Take buy positions above the pivot with targets at 33,678.00 & 33,774.00.
Alternative Price Action: Below 33,526.00 looks for further downside to 33,385.00 & 33,291.00.
Comment: RSI is above 50 levels and Pairs above 55MA.
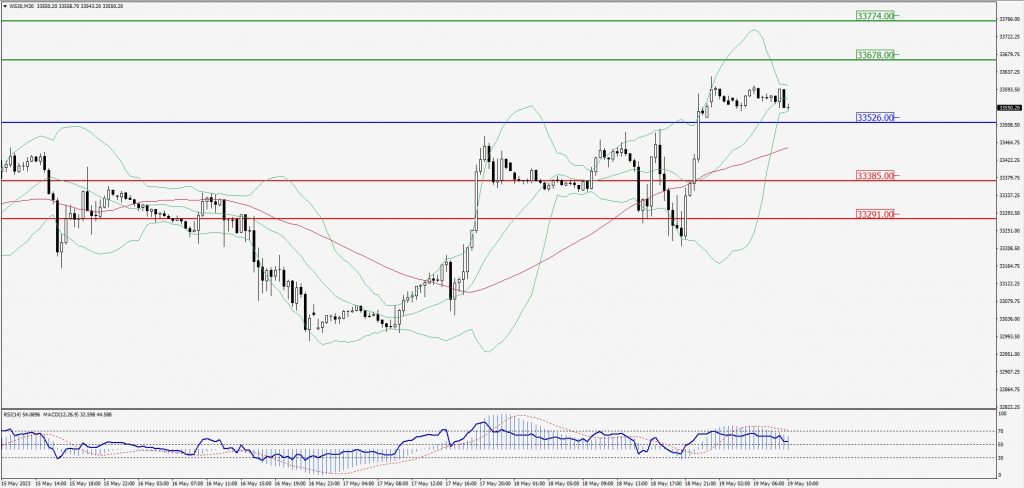
Green Lines Indicate Resistance Levels – Red Lines Indicate Support Levels
Light Blue is a Pivot Point – Black represents the price when the report was produced