Market Wrap: Stocks, Bonds, Commodities
Stock futures were flat in overnight trading as Wall Street braced for a key inflation report. Futures tied to the Dow Jones Industrial Average added 7 points, while S&P 500 futures and Nasdaq-100 futures inched slightly higher.
The Dow Jones Industrial Average fell 56.88 points to 33,561.81, the S&P 500 lose 0.46% to 4,119.17 and the Nasdaq Composite subtract 77.36 points to 12,179.55.
MSCI’s index of Asia-Pacific stocks outside Japan is decline 0.39% to 630.32 levels. The Australian index was lower by 0.12% to 7,255.70. Japanese Nikkei Index decline 0.41% today.
European stocks were negative on Wednesday, with the Stoxx Europe 50 Index fell 0.38% to 4,306.65, Germany’s DAX decline 0.39% to 15,895.65, and France’s CAC drop 0.31% to 7,375.05, and U.K.’s FTSE 100 subtract 0.22% to 7,746.93.
Benchmark 10-year U.S. Treasury fell as demand for safe assets ascend again, today 10-year bond yields negative 0.42% to 3.5070.
Oil prices edged higher on Tuesday, reversing a more than 2% drop earlier in the session, as markets weighed U.S. government’s plans to refill the nation’s emergency oil reserve and anticipated higher seasonal demand.
Spot Brent crude oil drop 1.02% to $76.65 per barrel. US West Texas Intermediate crude is down 1.00% to $72.97 a barrel.
The yellow metal gold is decline 0.25% to 2,037.75 dollars per ounce.
Market Wrap: Forex
The U.S. dollar edged lower in early European trade Wednesday, but gains are limited ahead of the release of the much anticipated April U.S. inflation report.
Today, the U.S. dollar index measures the Greenback against a trade-weighted basket of six major currencies, which surged 0.07% to 101.460.
The Euro US Dollar (EUR/USD) is a widely traded pair that is down 0.01% today. This left the pair trading around $1.09580.
The Japanese yen was negative against the U.S. dollar on Wednesday. Today USD/JPY is slipped 0.02% to the 135.190 level.
Another commodity-related currency mixed against the U.S dollar, AUD/USD fell 0.13% to 0.67520, and NZD/USD surged 0.02% to 0.63310 level.
EUR/USD Intraday: Trend on the upside
Our pivot point is at 1.09690
Preferable Price Action: Take buy positions above pivot level with targets at 1.09910 & 1.10080 in extension.
Alternative Price Action: Below pivot looks for a further downside to 1.09470 & 1.09310.
Comment: RSI is above 50 levels.
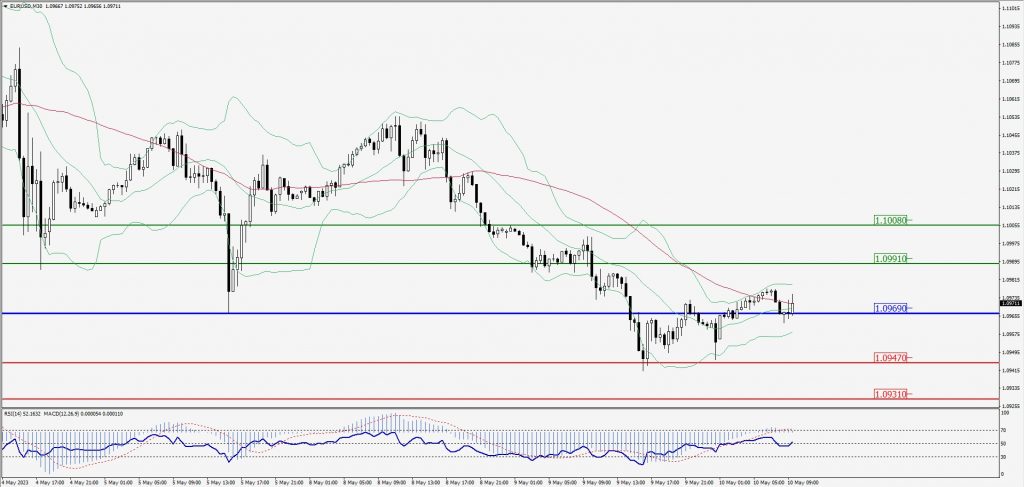
Green Lines Indicate Resistance Levels – Red Lines Indicate Support Levels
Light Blue is a Pivot Point – Black represents the price when the report was produced
GBP/USD Intraday: Support level at 1.26180
Our pivot point is at 1.26180
Preferable Price Action: Buy positions above pivot with targets at 1.26460 & 1.26650 in extension.
Alternative Price Action: The price below pivot would call for further downside to 1.25920 & 1.25750.
Comment: RSI is above 50 levels and Pairs above 55MA.
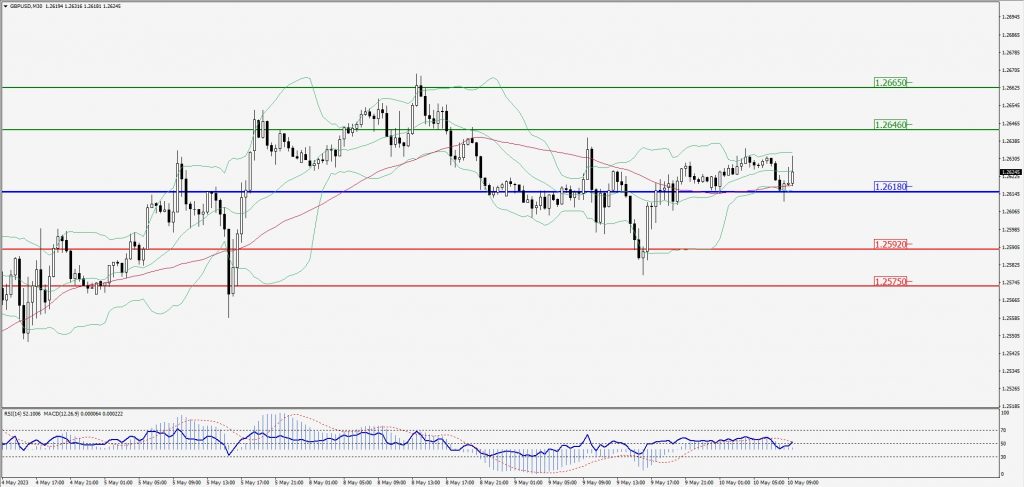
Green Lines Indicate Resistance Levels – Red Lines Indicate Support Levels
Light Blue is a Pivot Point – Black represents the price when the report was produced
USD/JPY Intraday: Trend on the upside
Our pivot point is at 135.220
Preferable Price Action: Buy position above pivot with the target at 135.710 and 136.010 in extension.
Alternative Price Action: The downside breakout of the pivot would call for 134.770 and 134.460.
Comment: MACD is above 50 level and Pairs above its 20MA & 55MA.
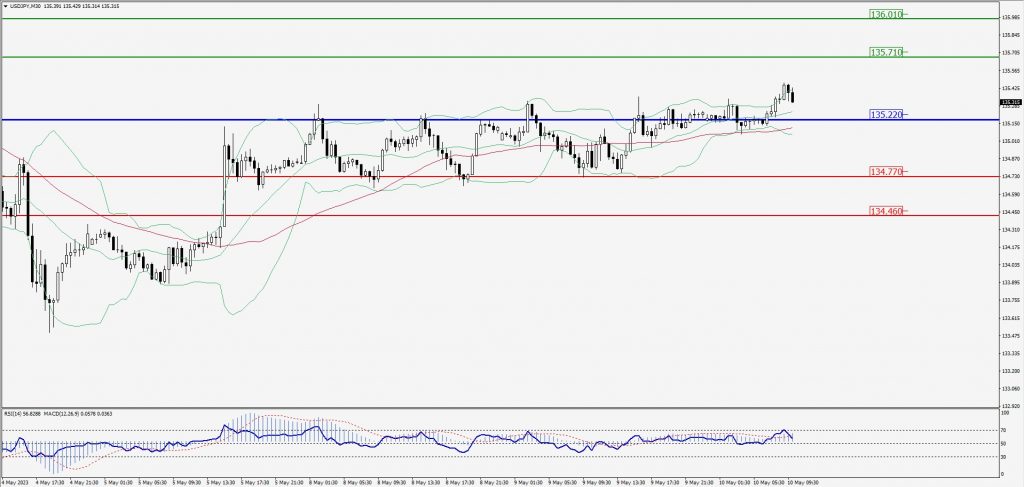
Green Lines Indicate Resistance Levels – Red Lines Indicate Support Levels
Light Blue is a Pivot Point – Black represents the price when the report was produced
AUD/USD Intraday: Trend on the upside
Our pivot point is at 0.67590
Preferable Price Action: Buy positions above pivot with targets at 0.67940 & 0.68160 in extension.
Alternative Price Action: Below pivot looks for a further downside with 0.67300 & 0.67110 as targets.
Comment: RSI is above 50 levels and Pairs above its 20MA & 55MA.
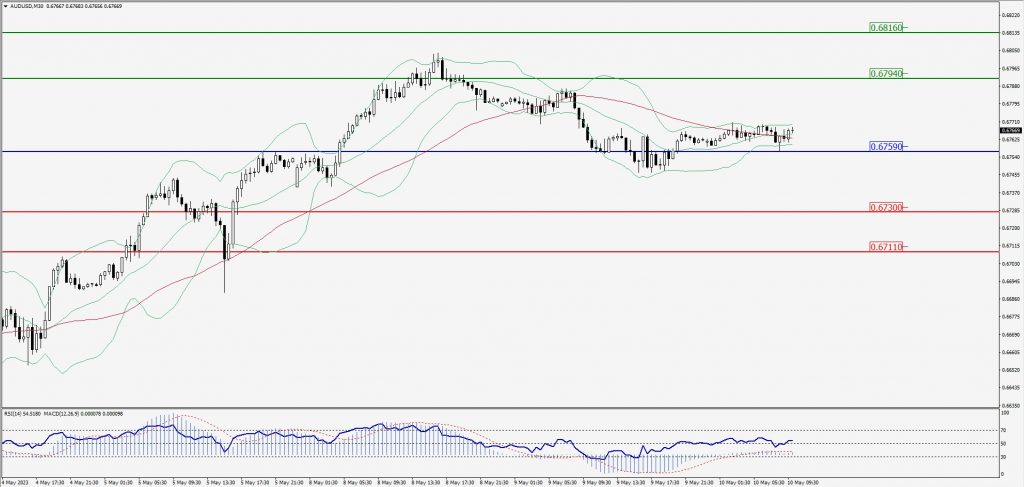
Green Lines Indicate Resistance Levels – Red Lines Indicate Support Levels
Light Blue is a Pivot Point – Black represents the price when the report was produced
CRUDEOIL Intraday: Support level at 73.01
Our pivot point is at 73.01
Preferable Price Action: Above pivot buy oil with 74.30 & 75.35 as targets.
Alternative Price Action: Sell crude below pivot with targets at 71.87 and 70.98 in extension.
Comment: MACD is positive territory and Pairs above 55MA.
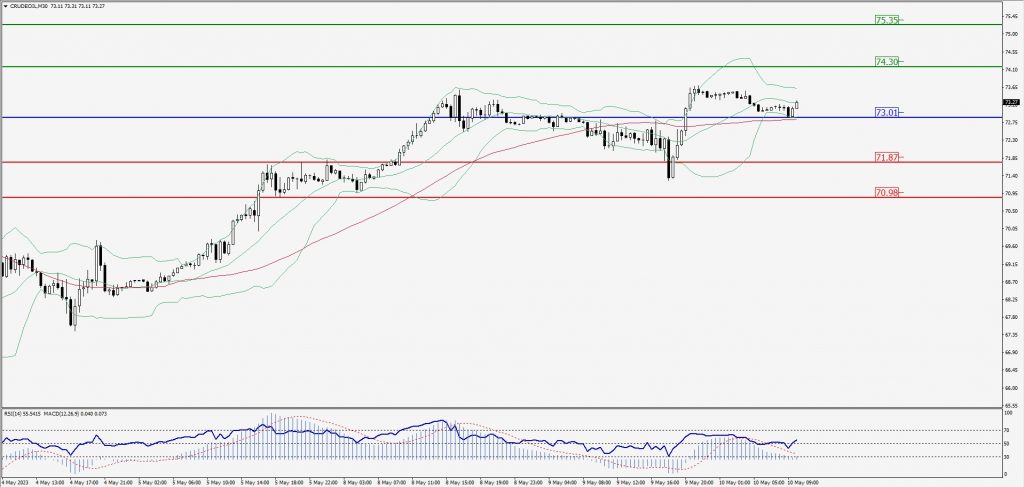
Green Lines Indicate Resistance Levels – Red Lines Indicate Support Levels
Light Blue is a Pivot Point – Black represents the price when the report was produced
XAU/USD Intraday: Trend on the downside
Our pivot point is 2035.70
Preferable Price Action: Further downside to 2024.50 and 2017.70
Alternative Price Action: If the price gives an upside breakout of a pivot, then the price extends to 2045.40 and 2052.60.
Comment: MACD is below 50 level and Pairs below 20MA.
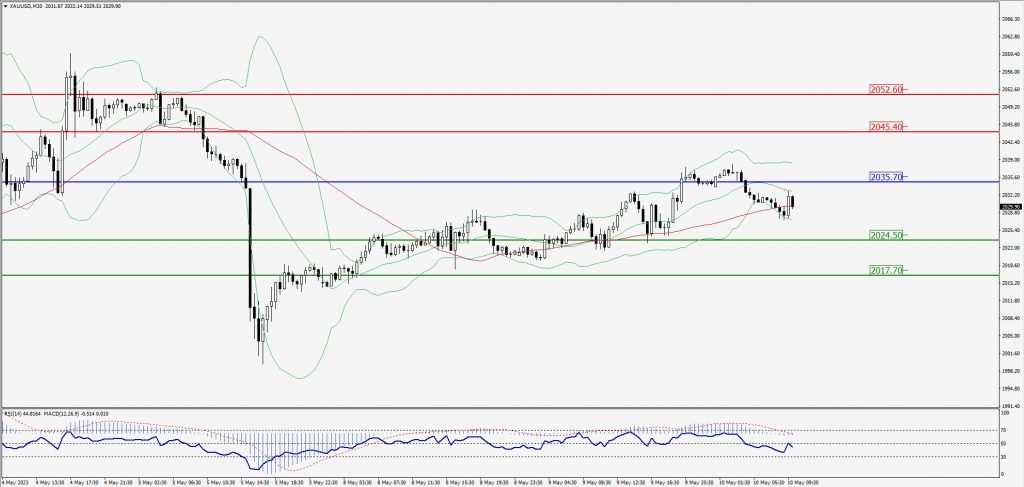
Green Lines Indicate Resistance Levels – Red Lines Indicate Support Levels
Light Blue is a Pivot Point – Black represents the price when the report was produced
Dow Jones Intraday: Major support level at 33,587.00
Our pivot point is 33,587.00
Preferable Price Action: Take buy positions above the pivot with targets at 33,749.00 & 33,870.00.
Alternative Price Action: Below 33,587.00 looks for further downside to 33,430.00 & 33,316.00.
Comment: RSI is above 50 levels and Pairs above its 20MA & 55MA.
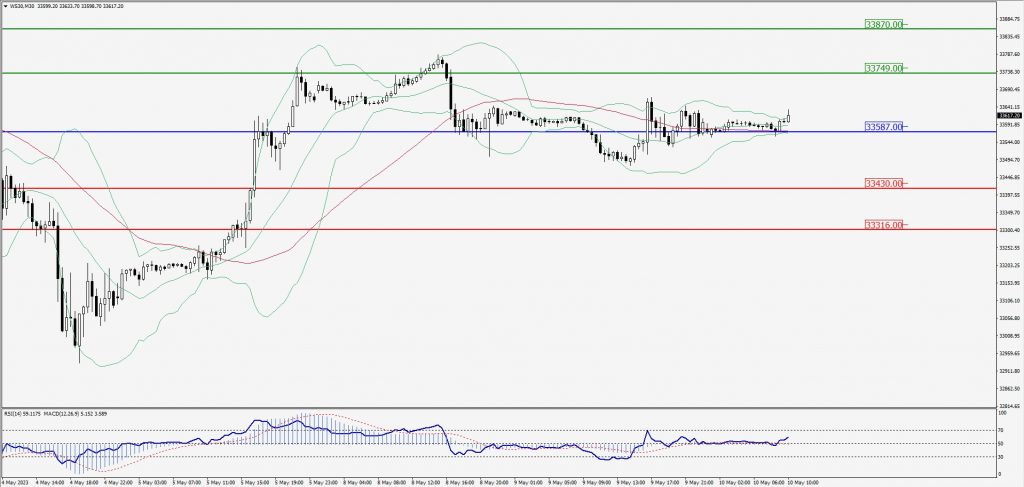
Green Lines Indicate Resistance Levels – Red Lines Indicate Support Levels
Light Blue is a Pivot Point – Black represents the price when the report was produced