Market Wrap: Stocks, Bonds, Commodities
S&P 500 futures changed little on Monday as investors readied for key inflation reports due later in the week.
The Dow Jones Industrial Average fell 55.69 points to 33,618.69, the S&P 500 gain 0.05% to 4,138.12 and the Nasdaq Composite add 21.50 points to 12,256.92.
MSCI’s index of Asia-Pacific stocks outside Japan is decline 0.87% to 632.86 levels. The Australian index was lower by 0.17% to 7,264.10. Japanese Nikkei Index advance 1.01% today.
European stocks were negative on Tuesday, with the Stoxx Europe 50 Index fell 0.52% to 4,325.85, Germany’s DAX decline 0.16% to 15,972.15, and France’s CAC drop 0.61% to 7,763.30, and U.K.’s FTSE 100 subtract 0.18% to 7,762.18.
Benchmark 10-year U.S. Treasury fell as demand for safe assets ascend again, today 10-year bond yields negative 0.61% to 3.4980.
Oil prices gained over 2 percent on Tuesday as the US recession fears eased, and some traders saw crude’s three-week slide on demand worries as overdone.
Spot Brent crude oil drop 0.48% to $76.63 per barrel. US West Texas Intermediate crude is down 0.52% to $72.79 a barrel.
The yellow metal gold is decline 0.04% to 2,032.40 dollars per ounce.
Market Wrap: Forex
The U.S. dollar edged higher in early European trade Tuesday, while sterling retained strength ahead of this week’s Bank of England policy-setting meeting.
Today, the U.S. dollar index measures the Greenback against a trade-weighted basket of six major currencies, which surged 0.14% to 101.300.
The Euro US Dollar (EUR/USD) is a widely traded pair that is down 0.19% today. This left the pair trading around $1.09830.
The Japanese yen was negative against the U.S. dollar on Tuesday. Today USD/JPY is slipped 0.01% to the 135.070 level.
Another commodity-related currency negative against the U.S dollar, AUD/USD fell 0.31% to 0.67610, and NZD/USD slipped 0.11% to 0.63360 level.
EUR/USD Intraday: Trend on the downside
Our pivot point is at 1.10000
Preferable Price Action: Take sell positions below pivot level with targets at 1.09620 & 1.09380 in extension.
Alternative Price Action: Above pivot looks for a further upside to 1.10300 & 1.10530.
Comment: RSI is below 50 levels and Pairs below 55MA.
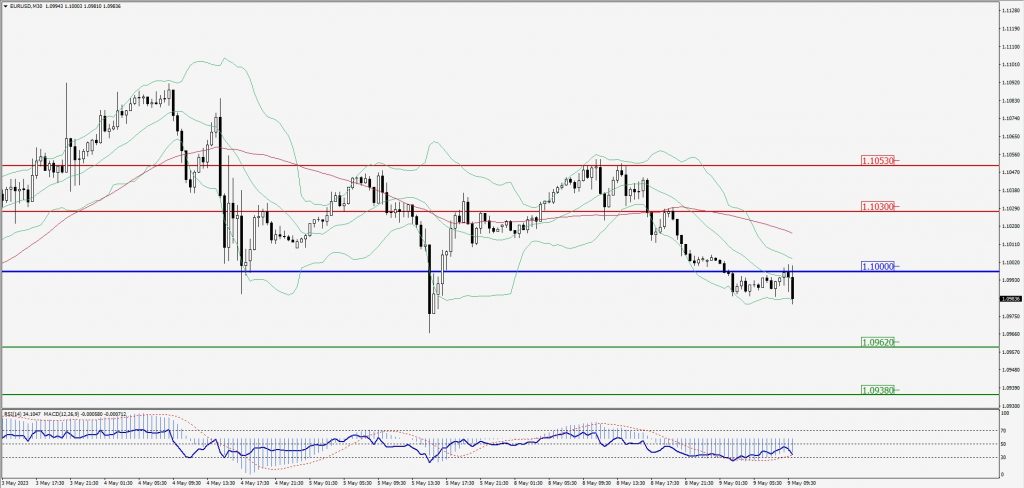
Green Lines Indicate Resistance Levels – Red Lines Indicate Support Levels
Light Blue is a Pivot Point – Black represents the price when the report was produced
GBP/USD Intraday: Resistance level at 1.26400
Our pivot point is at 1.26400
Preferable Price Action: Sell positions below pivot with targets at 1.25870 & 1.25540 in extension.
Alternative Price Action: The price above pivot would call for further upside to 1.26930 & 1.27290.
Comment: RSI is below 50 levels and Pairs below 55MA.
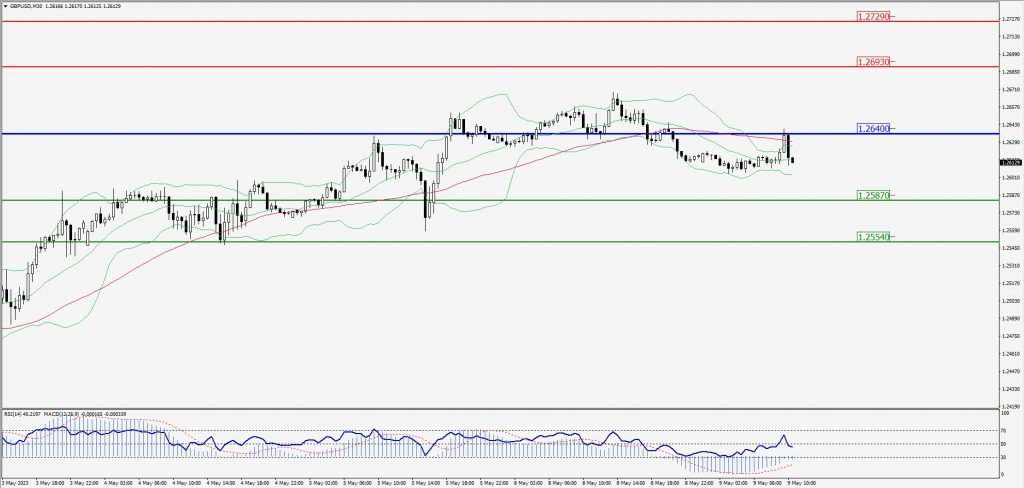
Green Lines Indicate Resistance Levels – Red Lines Indicate Support Levels
Light Blue is a Pivot Point – Black represents the price when the report was produced
USD/JPY Intraday: In a consolidation zone
Our pivot point is at 135.230
Preferable Price Action: Sell position below pivot with the target at 134.570 and 134.110 in extension.
Alternative Price Action: The upside breakout of the pivot would call for 135.780 and 136.270.
Comment: MACD is flat 50 level and Pairs below 20MA.
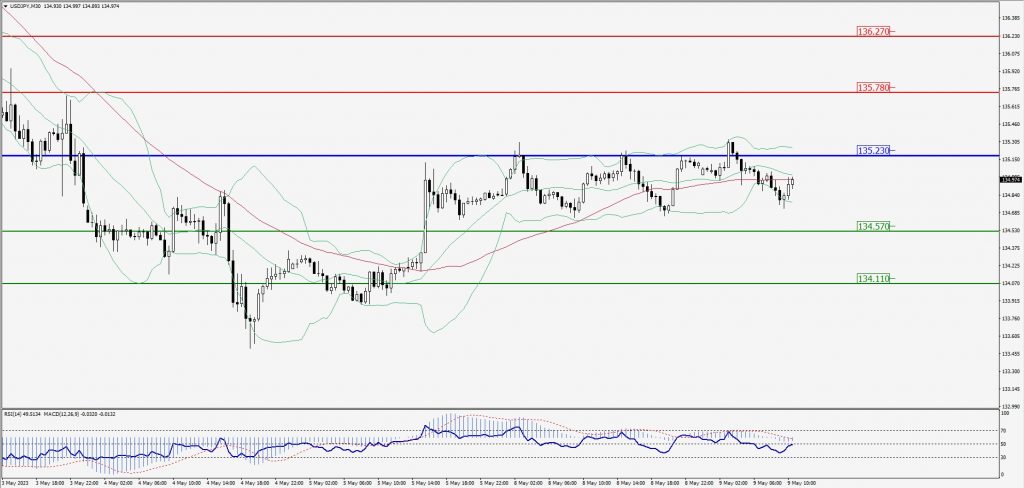
Green Lines Indicate Resistance Levels – Red Lines Indicate Support Levels
Light Blue is a Pivot Point – Black represents the price when the report was produced
AUD/USD Intraday: Major trend on the downside
Our pivot point is at 0.67770
Preferable Price Action: Sell positions below pivot with targets at 0.67430 & 0.67210 in extension.
Alternative Price Action: Above pivot looks for a further upside with 0.68080 & 0.68320 as targets.
Comment: RSI is below 50 levels and Pairs below its 20MA & 55MA.
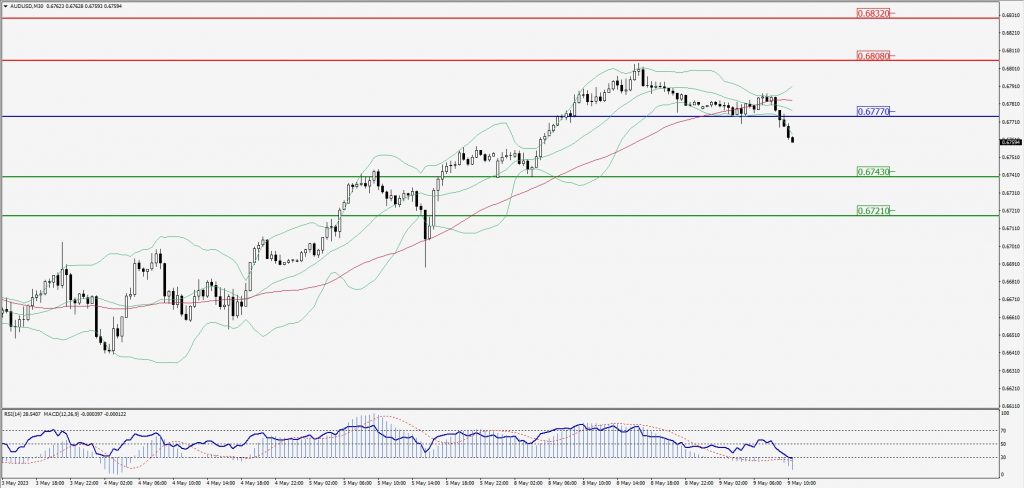
Green Lines Indicate Resistance Levels – Red Lines Indicate Support Levels
Light Blue is a Pivot Point – Black represents the price when the report was produced
CRUDEOIL Intraday: Resistance level at 73.14
Our pivot point is at 73.14
Preferable Price Action: Below pivot sell oil with 71.34 & 69.79 as targets.
Alternative Price Action: Buy crude above pivot with targets at 75.06 and 76.53 in extension.
Comment: MACD is negative territory and Pairs below its 20MA & 55MA.
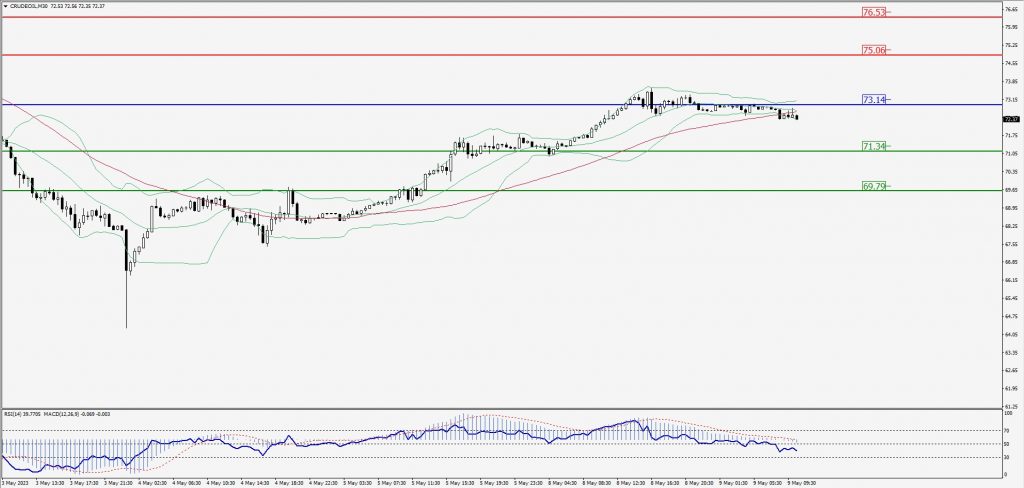
Green Lines Indicate Resistance Levels – Red Lines Indicate Support Levels
Light Blue is a Pivot Point – Black represents the price when the report was produced
XAU/USD Intraday: In a consolidation zone
Our pivot point is 2029.50
Preferable Price Action: Further downside to 2011.70 and 2000.50
Alternative Price Action: If the price gives an upside breakout of a pivot, then the price extends to 2044.00 and 2057.40.
Comment: MACD is at 50 level.
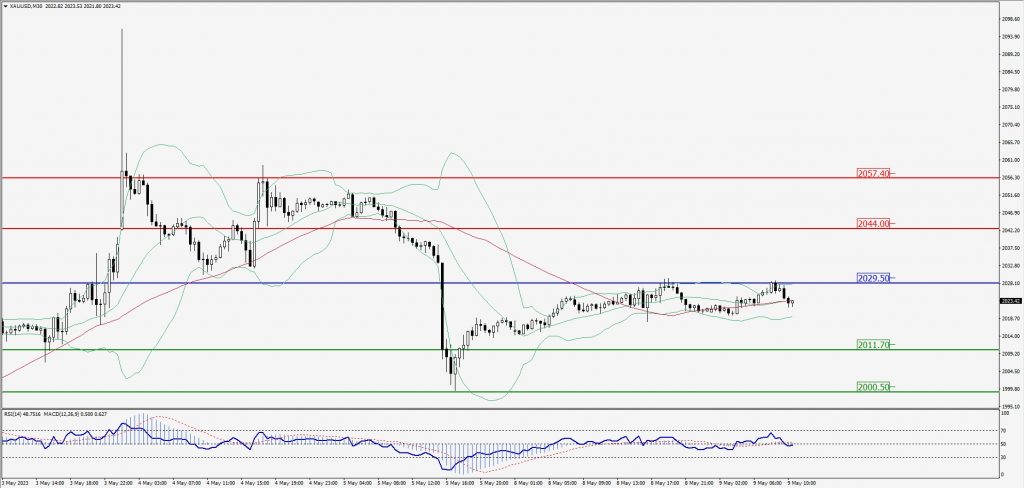
Green Lines Indicate Resistance Levels – Red Lines Indicate Support Levels
Light Blue is a Pivot Point – Black represents the price when the report was produced
Dow Jones Intraday: Trend on the downside
Our pivot point is 33,621.00
Preferable Price Action: Take sell positions below the pivot with targets at 33,440.00 & 33,323.00.
Alternative Price Action: Above 33,621.00 looks for further upside to 33,797.00 & 33,935.00.
Comment: RSI is below 50 levels and Pairs below its 20MA & 55MA.
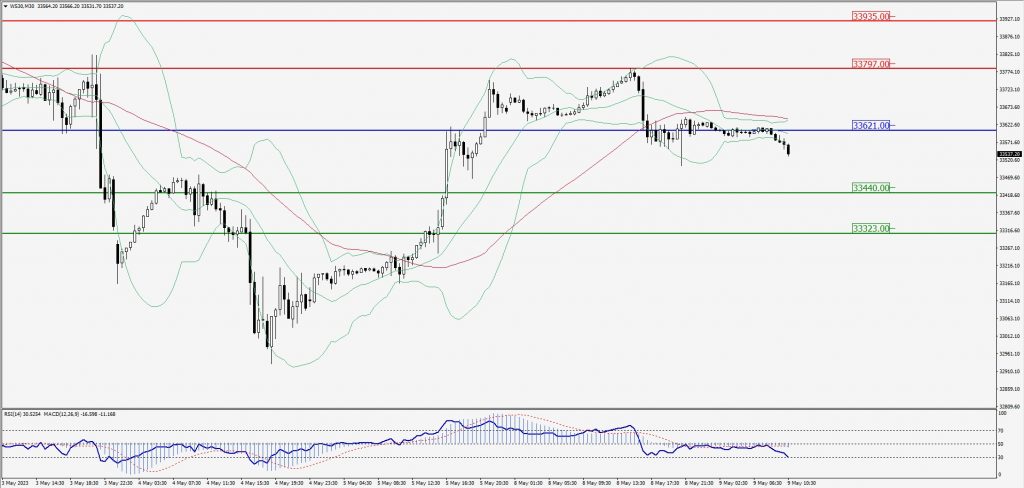
Green Lines Indicate Resistance Levels – Red Lines Indicate Support Levels
Light Blue is a Pivot Point – Black represents the price when the report was produced