Market Wrap: Stocks, Bonds, Commodities
The U.S. dollar fell in early European trade Friday, as traders fretted that the continued turmoil in the U.S. banking system could result in earlier-than-expected rate cuts by the Federal Reserve.
The Dow Jones Industrial Average fell 286.50 points to 33,127.74, the S&P 500 lose 0.72% to 4,061.22 and the Nasdaq Composite subtract 58.93 points to 11,966.40.
MSCI’s index of Asia-Pacific stocks outside Japan is advance 0.31% to 634.00 levels. The Australian index was higher by 0.37% to 7,220.00. Japanese Nikkei Index advance 0.12% today.
European stocks were negative on Friday, with the Stoxx Europe 50 Index rose 0.22% to 4,296.45, Germany’s DAX advance 0.64% to 15,833.75, and France’s CAC ascend 0.30% to 7,362.56, and U.K.’s FTSE 100 add 0.29% to 7,724.87.
Benchmark 10-year U.S. Treasury fell as demand for safe assets ascend again, today 10-year bond yields positive 1.35% to 3.3970.
Oil prices settled nearly unchanged on Friday after the European Central Bank (ECB) decided to slow the pace of interest rate hikes, with prices still down more than 9 percent for the week on demand concerns in major consuming countries.
Spot Brent crude oil ascend 1.41% to $73.52 per barrel. US West Texas Intermediate crude is up 1.33% to $69.47 a barrel.
The yellow metal gold is decline 0.43% to 2,046.85 dollars per ounce.
Market Wrap: Forex
The U.S. dollar retreated in early European trade Thursday, continuing the previous session’s selloff after the Federal Reserve signaled a pause to its year-long tightening cycle after its latest interest rate hike.
Today, the U.S. dollar index measures the Greenback against a trade-weighted basket of six major currencies, which surged 0.10% to 101.080.
The Euro US Dollar (EUR/USD) is a widely traded pair that is up 0.15% today. This left the pair trading around $1.10280.
The Japanese yen was negative against the U.S. dollar on Friday. Today USD/JPY is slipped 0.05% to the 134.190 level.
Another commodity-related currency positive against the U.S dollar, AUD/USD rose 0.47% to 0.67250, and NZD/USD surged 0.22% to 0.62920 level.
EUR/USD Intraday: Trend on the downside
Our pivot point is at 1.10400
Preferable Price Action: Take sell positions below pivot level with targets at 1.09890 & 1.09600 in extension.
Alternative Price Action: Above pivot looks for a further upside to 1.10850 & 1.11140.
Comment: RSI is below 50 levels and Pairs below its 20MA & 55MA.
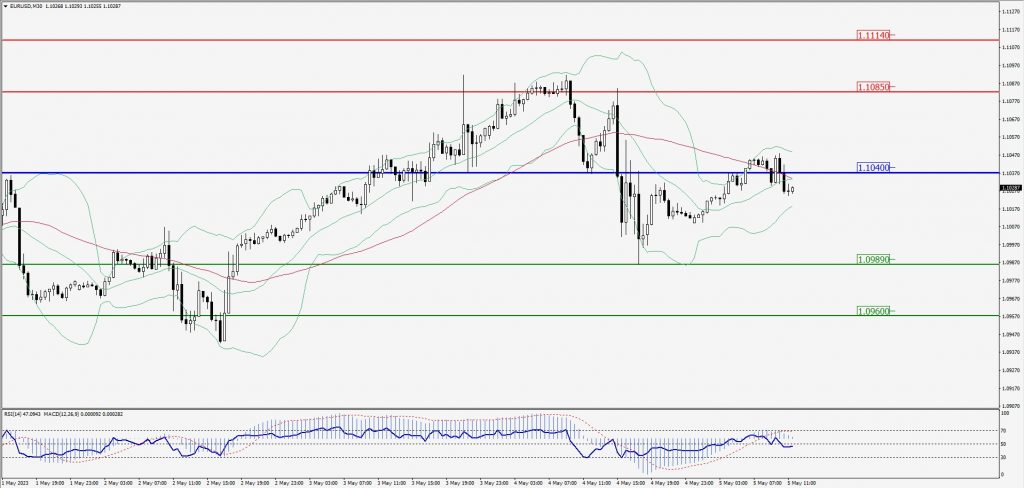
Green Lines Indicate Resistance Levels – Red Lines Indicate Support Levels
Light Blue is a Pivot Point – Black represents the price when the report was produced
GBP/USD Intraday: Trend on the upside
Our pivot point is at 1.25910
Preferable Price Action: Buy positions above pivot with targets at 1.26310 & 1.26600 in extension.
Alternative Price Action: The price below pivot would call for further downside to 1.25570 & 1.25350.
Comment: RSI is above 50 levels and Pairs above its 20MA & 55MA.
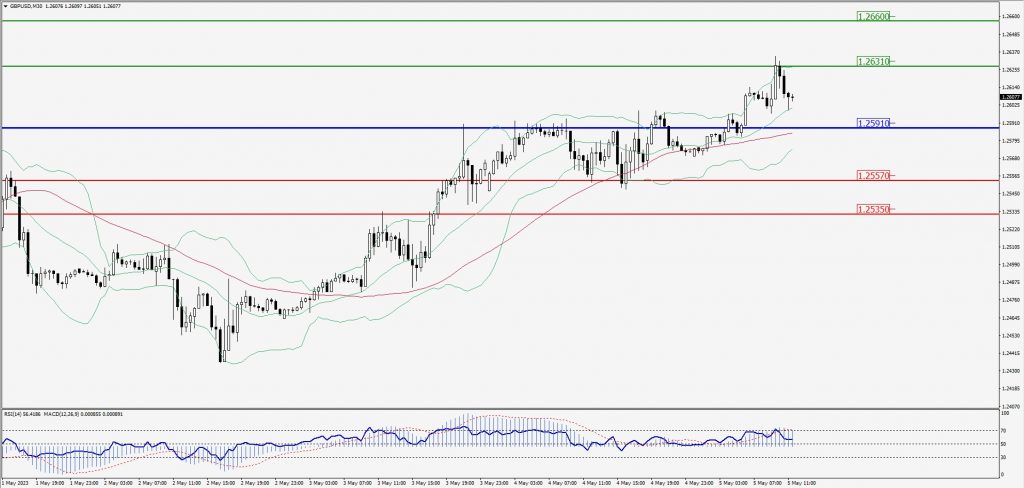
Green Lines Indicate Resistance Levels – Red Lines Indicate Support Levels
Light Blue is a Pivot Point – Black represents the price when the report was produced
USD/JPY Intraday: In a consolidation zone
Our pivot point is at 134.360
Preferable Price Action: Sell position below pivot with the target at 133.500 and 132.810 in extension.
Alternative Price Action: The upside breakout of the pivot would call for 135.210 and 135.880.
Comment: MACD is negative 50 level and Pairs below 55MA.
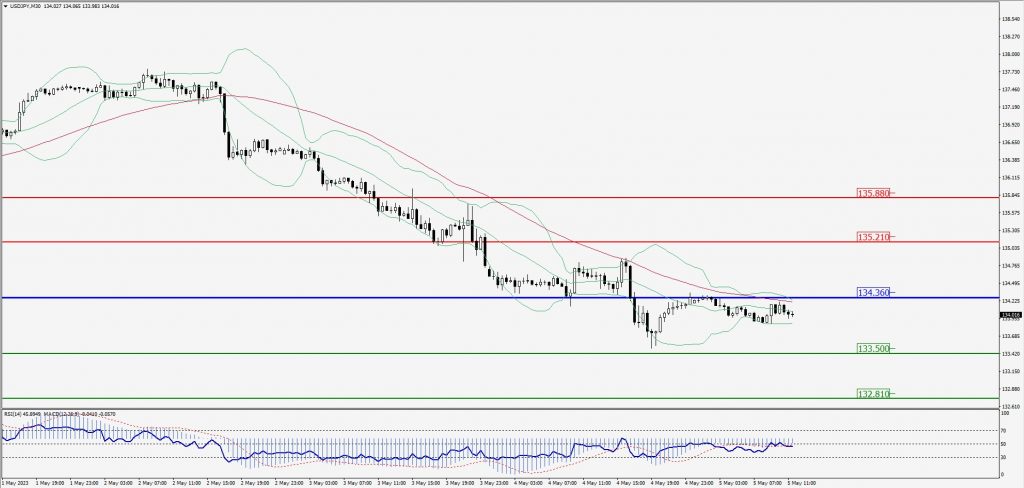
Green Lines Indicate Resistance Levels – Red Lines Indicate Support Levels
Light Blue is a Pivot Point – Black represents the price when the report was produced
AUD/USD Intraday: Trend on the upside
Our pivot point is at 0.67230
Preferable Price Action: Buy positions above pivot with targets at 0.67480 & 0.67660 in extension.
Alternative Price Action: Below pivot looks for a further downside with 0.67000 & 0.66820 as targets.
Comment: RSI is above 50 levels and Pairs above its 20MA & 55MA.
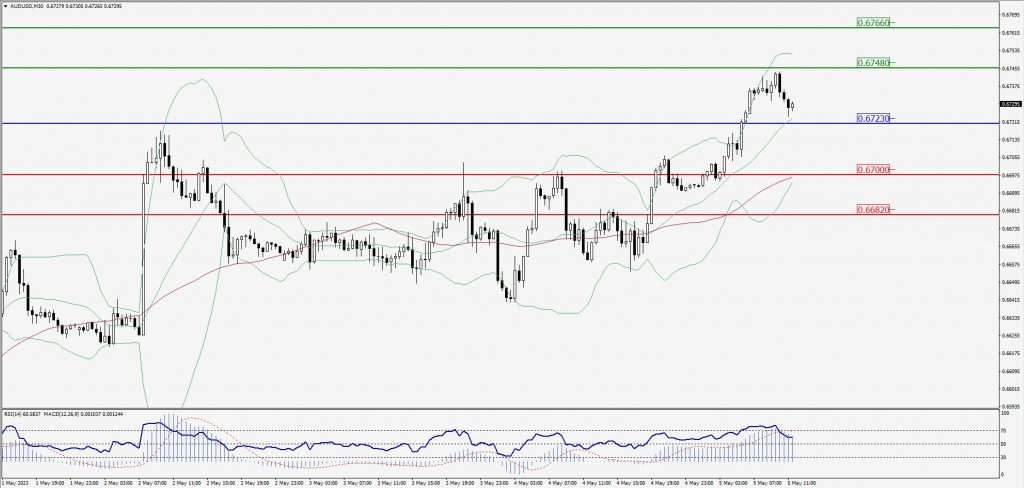
Green Lines Indicate Resistance Levels – Red Lines Indicate Support Levels
Light Blue is a Pivot Point – Black represents the price when the report was produced
CRUDEOIL Intraday: Support level at 69.01
Our pivot point is at 69.01
Preferable Price Action: Above pivot buy oil with 70.98 & 72.33 as targets.
Alternative Price Action: Sell crude below pivot with targets at 67.14 and 65.97 in extension.
Comment: MACD is positive territory and Pairs above its 20MA & 55MA.
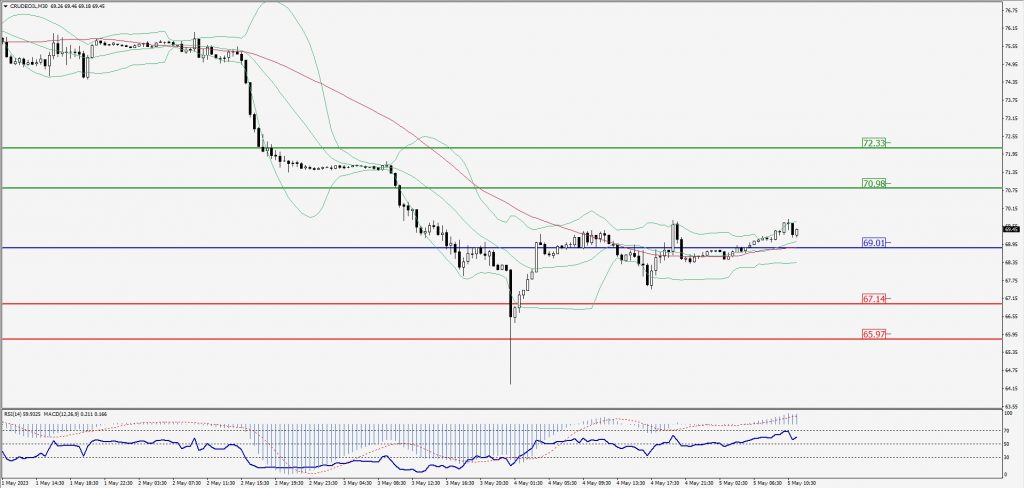
Green Lines Indicate Resistance Levels – Red Lines Indicate Support Levels
Light Blue is a Pivot Point – Black represents the price when the report was produced
XAU/USD Intraday: Resistance level at 2052.10
Our pivot point is 2052.10
Preferable Price Action: Further downside to 2028.50 and 2014.20
Alternative Price Action: If the price gives an upside breakout of a pivot, then the price extends to 2072.30 and 2088.20.
Comment: MACD is below 50 level and Pairs below its 20MA & 55MA.
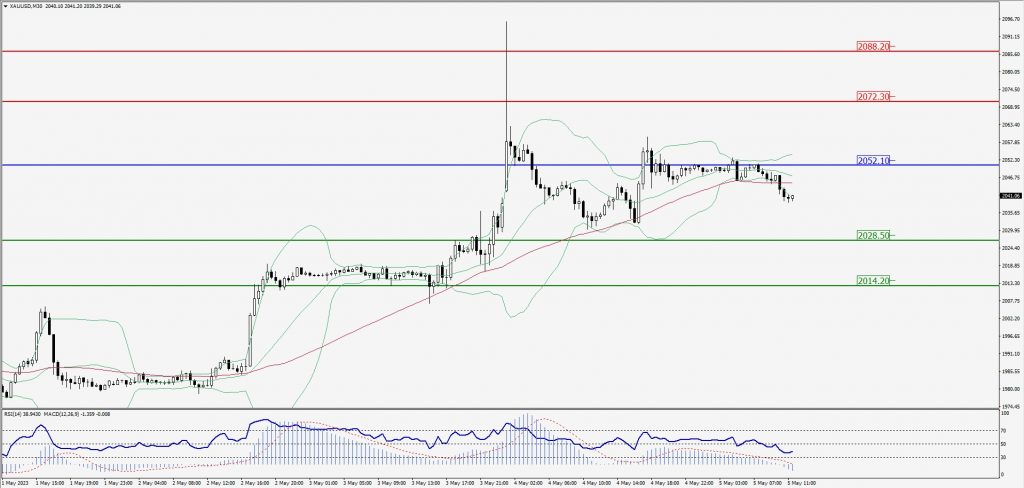
Green Lines Indicate Resistance Levels – Red Lines Indicate Support Levels
Light Blue is a Pivot Point – Black represents the price when the report was produced
Dow Jones Intraday: Trend on the upside
Our pivot point is 33,189.00
Preferable Price Action: Take buy positions above the pivot with targets at 33,458.00 & 33,628.00.
Alternative Price Action: Below 33,189.00 looks for further downside to 32,981.00 & 32,830.00.
Comment: RSI is above 50 levels.
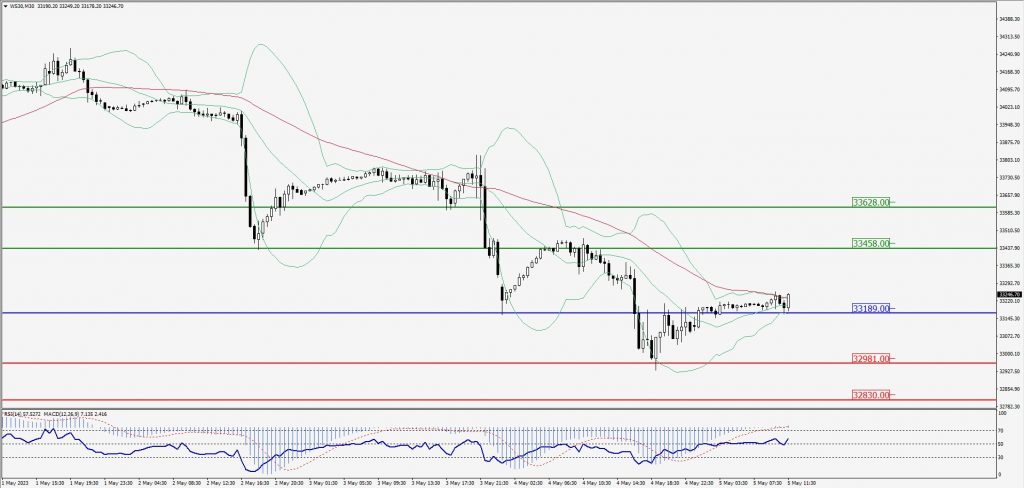
Green Lines Indicate Resistance Levels – Red Lines Indicate Support Levels
Light Blue is a Pivot Point – Black represents the price when the report was produced