Market Wrap: Stocks, Bonds, Commodities
S&P 500 futures fell after the Federal Reserve hiked rates by another 25 basis points and investors’ fears of contagion in the regional bank space returned.
The Dow Jones Industrial Average fell 270.29 points to 33,414.24, the S&P 500 lose 0.70% to 4,090.75 and the Nasdaq Composite subtract 55.18 points to 12,025.33.
MSCI’s index of Asia-Pacific stocks outside Japan is advance 0.78% to 631.42 levels. The Australian index was lower by 0.06% to 7,193.10. Japanese Nikkei Index advance 0.12% today.
European stocks were negative on Thursday, with the Stoxx Europe 50 Index fell 0.78% to 4,276.35, Germany’s DAX decline 0.77% to 15,692.55, and France’s CAC drop 0.84% to 7,341.72, and U.K.’s FTSE 100 subtract 0.76% to 7,729.89.
Benchmark 10-year U.S. Treasury fell as demand for safe assets ascend again, today 10-year bond yields negative 0.83% to 3.3750.
Oil prices fell 4 percent on Wednesday, extending steep losses from the previous session after the US Federal Reserve raised interest rates and as investors fretted about the economy.
Spot Brent crude oil ascend 0.93% to $72.98 per barrel. US West Texas Intermediate crude is up 0.58% to $69.03 a barrel.
The yellow metal gold is advance 0.48% to 2,046.90 dollars per ounce.
Market Wrap: Forex
The U.S. dollar retreated in early European trade Thursday, continuing the previous session’s selloff after the Federal Reserve signaled a pause to its year-long tightening cycle after its latest interest rate hike.
Today, the U.S. dollar index measures the Greenback against a trade-weighted basket of six major currencies, which slipped 0.04% to 101.070.
The Euro US Dollar (EUR/USD) is a widely traded pair that is up 0.05% today. This left the pair trading around $1.10520.
The Japanese yen was negative against the U.S. dollar on Thursday. Today USD/JPY is slipped 0.15% to the 134.450 level.
Another commodity-related currency positive against the U.S dollar, AUD/USD rose 0.08% to 0.66740, and NZD/USD surged 0.39% to 0.62500 level.
EUR/USD Intraday: Trend on the downside
Our pivot point is at 1.10570
Preferable Price Action: Take sell positions below pivot level with targets at 1.10290 & 1.10140 in extension.
Alternative Price Action: Above pivot looks for a further upside to 1.10800 & 1.10960.
Comment: RSI is below 50 levels and Pairs below its 20MA & 55MA.
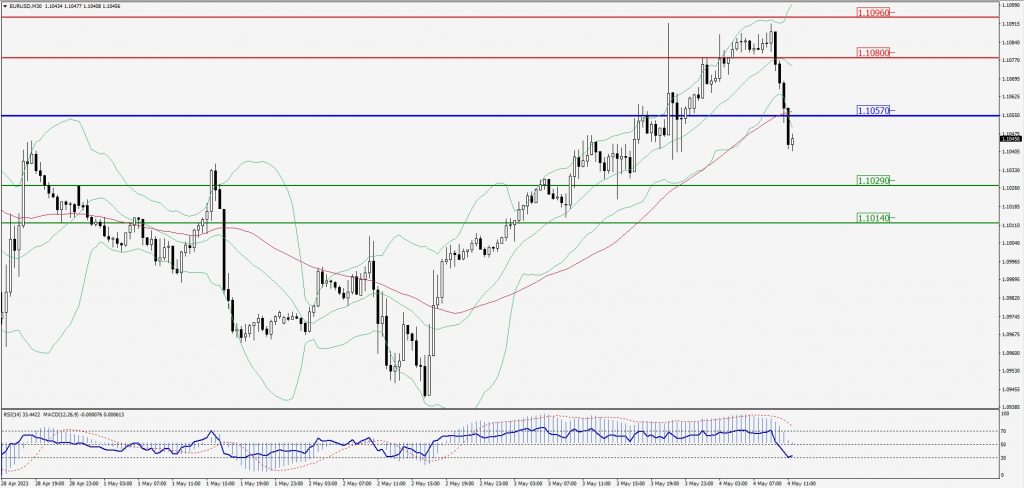
Green Lines Indicate Resistance Levels – Red Lines Indicate Support Levels
Light Blue is a Pivot Point – Black represents the price when the report was produced
GBP/USD Intraday: In a consolidation zone
Our pivot point is at 1.25770
Preferable Price Action: Sell positions below pivot with targets at 1.25480 & 1.25280 in extension.
Alternative Price Action: The price above pivot would call for further upside to 1.26010 & 1.26210.
Comment: RSI is at 50 levels and Pairs below 20MA.
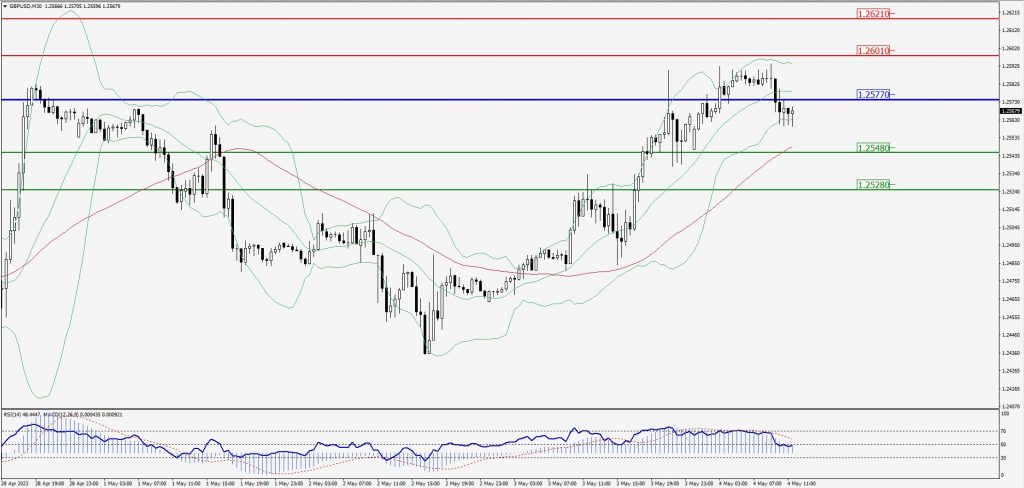
Green Lines Indicate Resistance Levels – Red Lines Indicate Support Levels
Light Blue is a Pivot Point – Black represents the price when the report was produced
USD/JPY Intraday: In a consolidation zone
Our pivot point is at 135.030
Preferable Price Action: Sell position below pivot with the target at 134.300 and 133.820 in extension.
Alternative Price Action: The upside breakout of the pivot would call for 135.700 and 136.160.
Comment: MACD is flat 50 level and Pairs below 55MA.
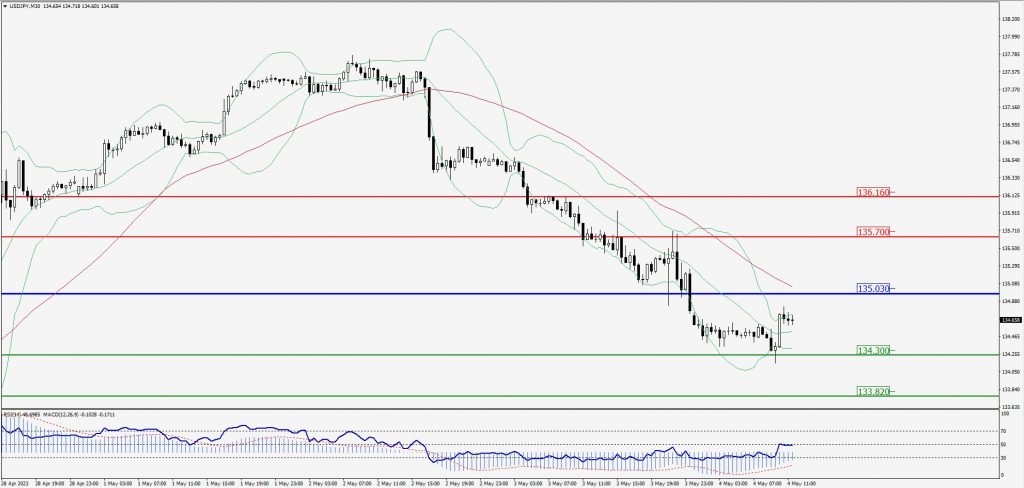
Green Lines Indicate Resistance Levels – Red Lines Indicate Support Levels
Light Blue is a Pivot Point – Black represents the price when the report was produced
AUD/USD Intraday: Resistance level at 0.66750
Our pivot point is at 0.66750
Preferable Price Action: Sell positions below pivot with targets at 0.66380 & 0.66170 in extension.
Alternative Price Action: Above pivot looks for a further upside with 0.67060 & 0.67310 as targets.
Comment: RSI is below 50 levels and Pairs below 55MA.
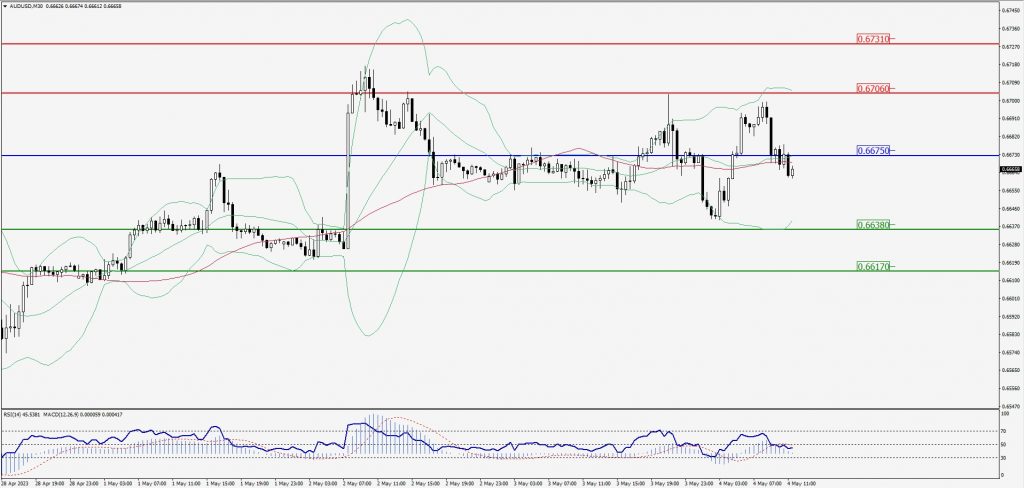
Green Lines Indicate Resistance Levels – Red Lines Indicate Support Levels
Light Blue is a Pivot Point – Black represents the price when the report was produced
CRUDEOIL Intraday: Trend on the upside
Our pivot point is at 69.00
Preferable Price Action: Above pivot buy oil with 70.99 & 72.33 as targets.
Alternative Price Action: Sell crude below pivot with targets at 67.14 and 65.96 in extension.
Comment: MACD is positive territory and Pairs above 20MA.
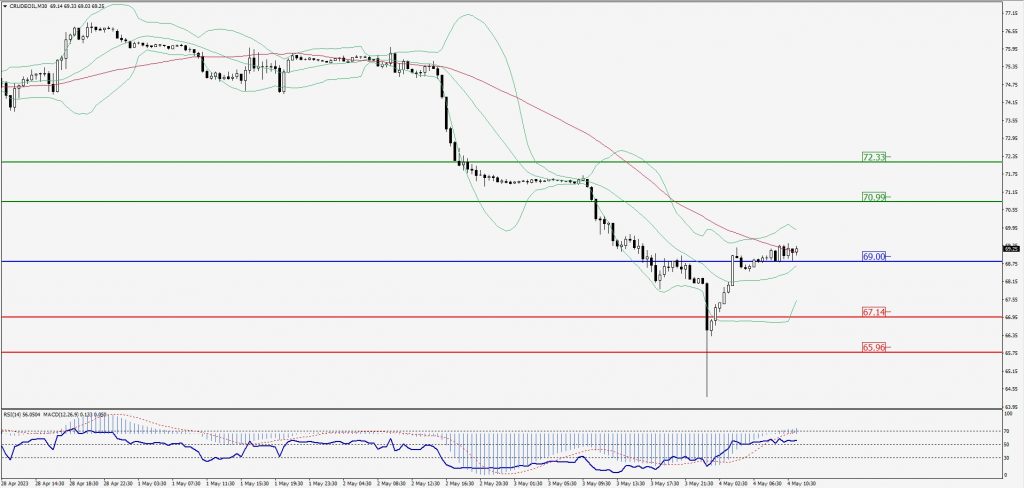
Green Lines Indicate Resistance Levels – Red Lines Indicate Support Levels
Light Blue is a Pivot Point – Black represents the price when the report was produced
XAU/USD Intraday: Trend on the downside
Our pivot point is 2041.20
Preferable Price Action: Further downside to 2020.80 and 2006.90
Alternative Price Action: If the price gives an upside breakout of a pivot, then the price extends to 2060.90 and 2076.00.
Comment: MACD is below 50 level and Pairs below 20MA.
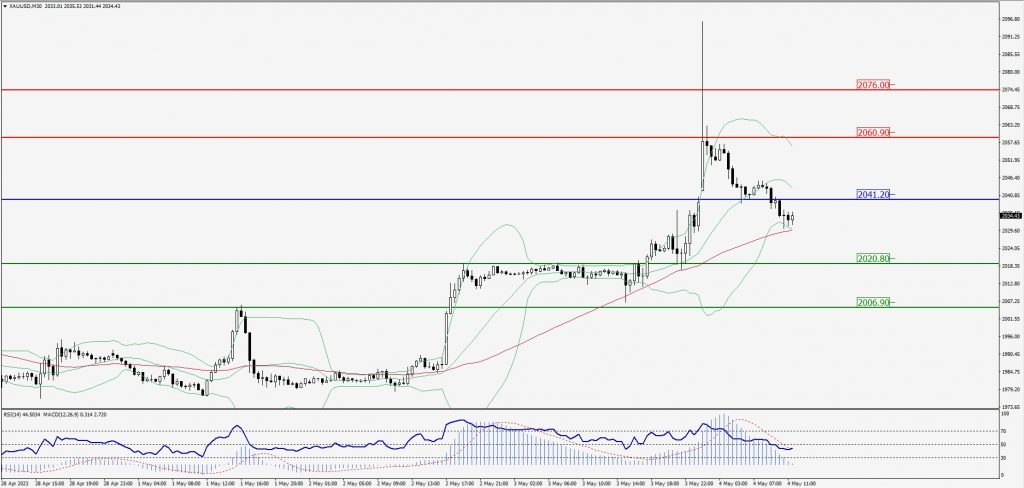
Green Lines Indicate Resistance Levels – Red Lines Indicate Support Levels
Light Blue is a Pivot Point – Black represents the price when the report was produced
Dow Jones Intraday: Trend on the downside
Our pivot point is 33,496.00
Preferable Price Action: Take sell positions below the pivot with targets at 33,208.00 & 33,052.00.
Alternative Price Action: Above 33,781.00 looks for further upside to 33,921.00 & 34,029.00.
Comment: RSI is below 50 levels and Pairs below 55MA.
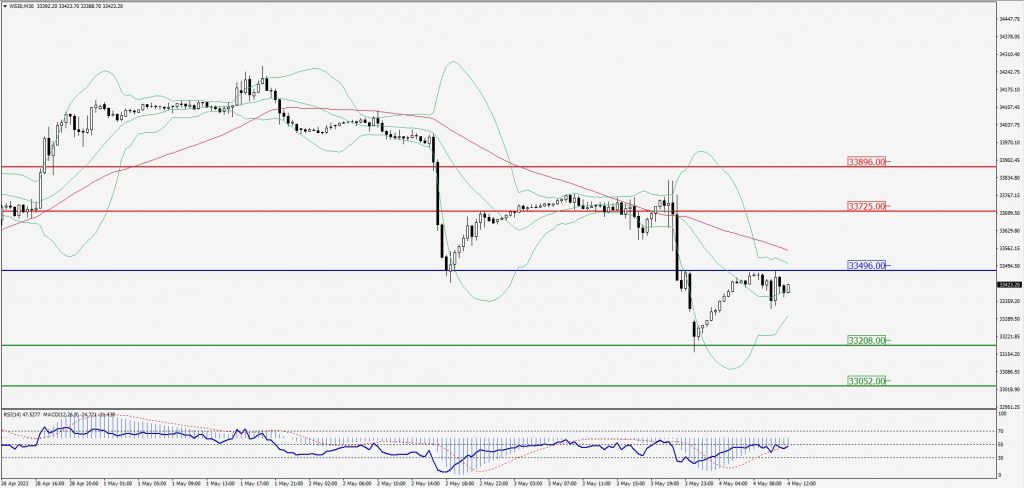
Green Lines Indicate Resistance Levels – Red Lines Indicate Support Levels
Light Blue is a Pivot Point – Black represents the price when the report was produced