Market Wrap: Stocks, Bonds, Commodities
The Dow Jones Industrial Average inched lower Monday in the wake of the government’s seizure of First Republic over the weekend and the bank’s subsequent sale to JPMorgan Chase.
The Dow Jones Industrial Average fell 46.46 points to 34,051.70, the S&P 500 lose 0.04% to 4,167.87 and the Nasdaq Composite subtract 13.99 points to 12,212.60.
MSCI’s index of Asia-Pacific stocks outside Japan is advance 0.15% to 631.16 levels. The Australian index was lower by 0.92% to 7,267.40. Japanese Nikkei Index advance 0.12% today.
European stocks were negative on Tuesday, with the Stoxx Europe 50 Index fell 0.47% to 4,339.95, Germany’s DAX decline 0.40% to 15,859.95, and France’s CAC drop 0.50% to 7,450.65, and U.K.’s FTSE 100 subtract 0.05% to 7,866.70.
Benchmark 10-year U.S. Treasury fell as demand for safe assets ascend again, today 10-year bond yields negative 1.12% to 3.5340.
Oil fell on Monday as concern over the economic impact of the US Federal Reserve potentially raising interest rates and weaker Chinese manufacturing data outweighed support from new OPEC+ supply cuts taking effect this month.
Spot Brent crude oil drop 0.45% to $78.98 per barrel. US West Texas Intermediate crude is down 0.46% to $75.31 a barrel.
The yellow metal gold is advance 0.04% to 1,993.05 dollars per ounce.
Market Wrap: Forex
The U.S. dollar fell back from the previous session’s two-week high in early European trade Tuesday ahead of the start of the Federal Reserve’s two-day policy meeting, while the Australian dollar soared after the RBA surprised with a rate hike.
Today, the U.S. dollar index measures the Greenback against a trade-weighted basket of six major currencies, which surged 0.16% to 102.080.
The Euro US Dollar (EUR/USD) is a widely traded pair that is down 0.22% today. This left the pair trading around $1.09510.
The Japanese yen was negative against the U.S. dollar on Tuesday. Today USD/JPY is slipped 0.04% to the 137.420 level.
Another commodity-related currency positive against the U.S dollar, AUD/USD rose 0.83% to 0.66850, and NZD/USD surged 0.34% to 0.61890 level.
EUR/USD Intraday: Trend on the upside
Our pivot point is at 1.09720
Preferable Price Action: Take sell positions below pivot level with targets at 1.09310 & 1.09060 in extension.
Alternative Price Action: Above pivot looks for a further upside to 1.10080 & 1.10350.
Comment: RSI is below 50 levels and Pairs below its 20MA & 55MA.
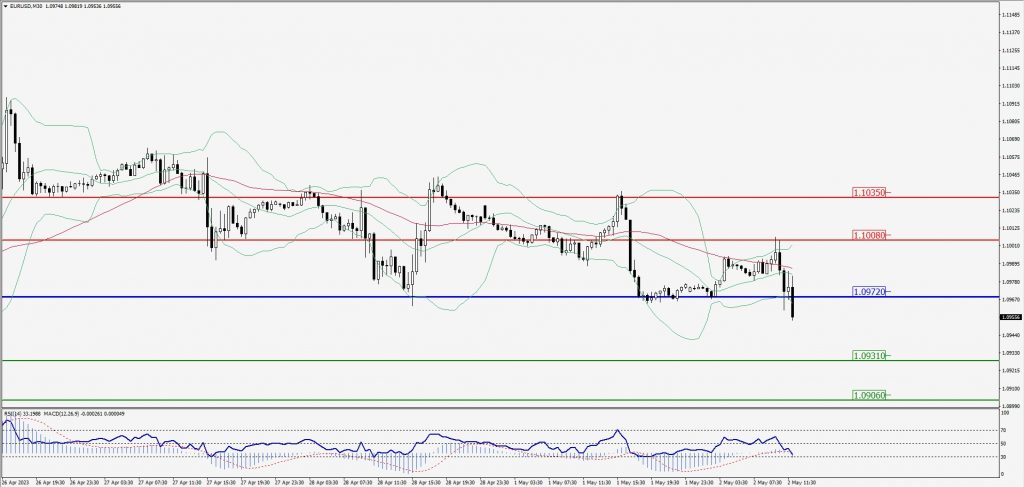
Green Lines Indicate Resistance Levels – Red Lines Indicate Support Levels
Light Blue is a Pivot Point – Black represents the price when the report was produced
GBP/USD Intraday: Trend on the downside
Our pivot point is at 1.24800
Preferable Price Action: Sell positions below pivot with targets at 1.24330 & 1.24040 in extension.
Alternative Price Action: The price above pivot would call for further upside to 1.25210 & 1.25530.
Comment: RSI is below 50 levels and Pairs below its 20MA & 55MA.
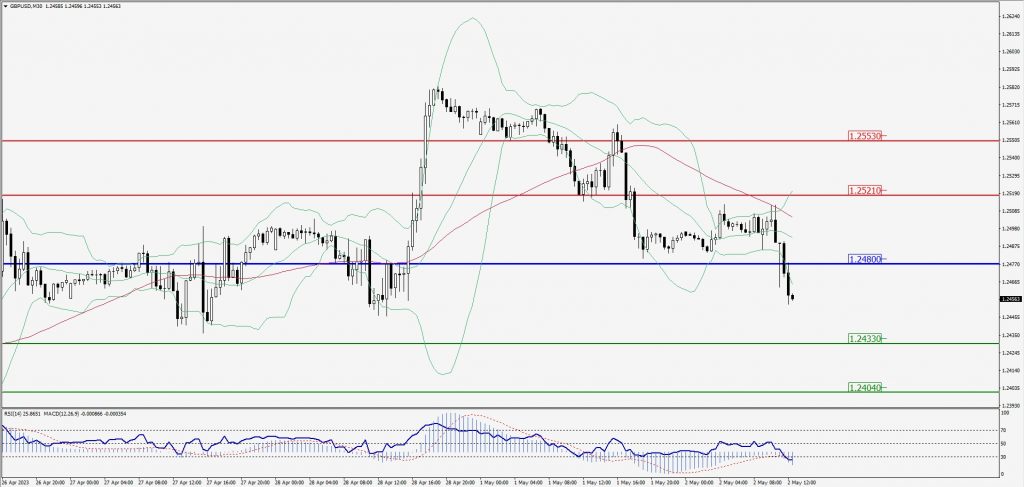
Green Lines Indicate Resistance Levels – Red Lines Indicate Support Levels
Light Blue is a Pivot Point – Black represents the price when the report was produced
USD/JPY Intraday: In a consolidation zone
Our pivot point is at 137.270
Preferable Price Action: Buy position above pivot with the target at 138.020 and 138.600 in extension.
Alternative Price Action: The downside breakout of the pivot would call for 136.500 and 135.950.
Comment: MACD is at 50 level and Pairs above 55MA.
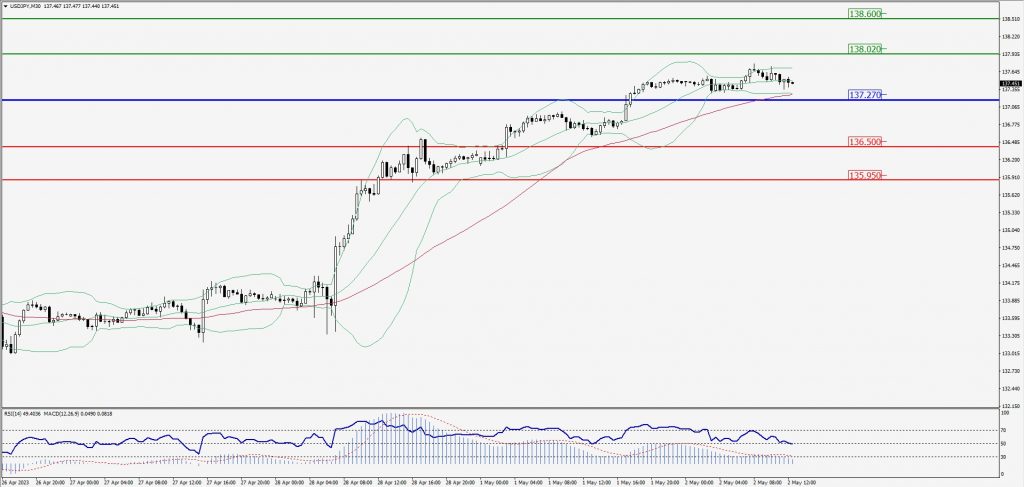
Green Lines Indicate Resistance Levels – Red Lines Indicate Support Levels
Light Blue is a Pivot Point – Black represents the price when the report was produced
AUD/USD Intraday: Trend on the upside
Our pivot point is at 0.66820
Preferable Price Action: Buy positions above pivot with targets at 0.67050 & 0.67200 in extension.
Alternative Price Action: Below pivot looks for a further downside with 0.66620 & 0.66480 as targets.
Comment: RSI is above 50 levels and Pairs above its 20MA & 55MA.
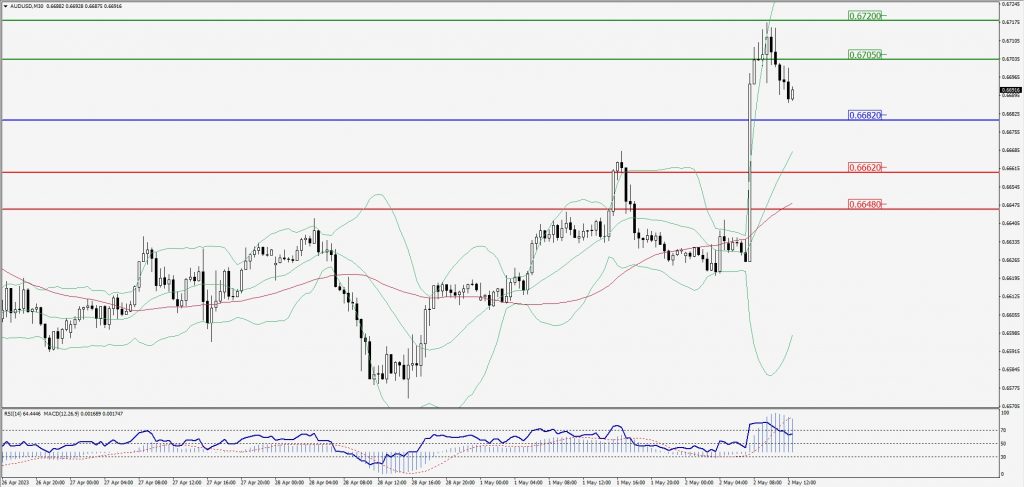
Green Lines Indicate Resistance Levels – Red Lines Indicate Support Levels
Light Blue is a Pivot Point – Black represents the price when the report was produced
CRUDEOIL Intraday: Trend on the downside
Our pivot point is at 75.62
Preferable Price Action: Below pivot sell oil with 74.62 & 74.03 as targets.
Alternative Price Action: Buy crude above pivot with targets at 76.53 and 77.18 in extension.
Comment: MACD is negative territory and Pairs below its 20MA & 55MA.
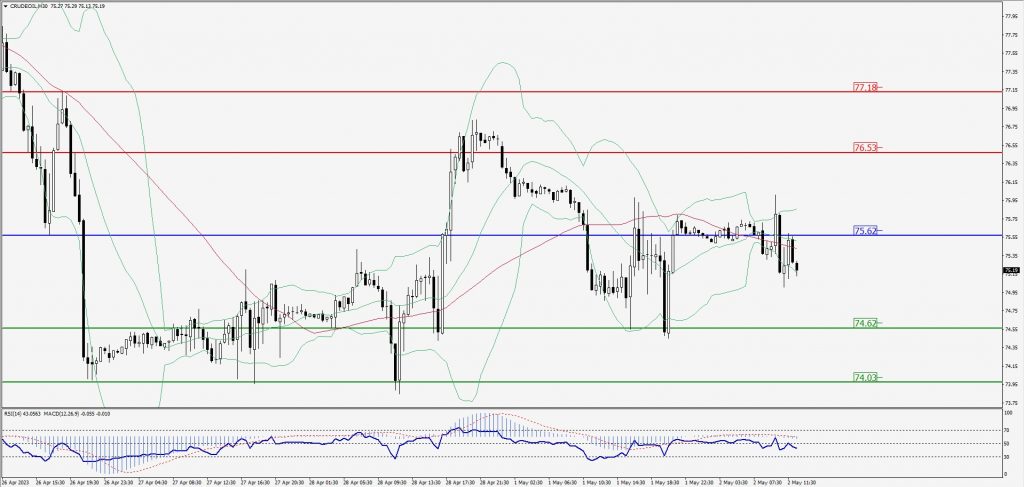
Green Lines Indicate Resistance Levels – Red Lines Indicate Support Levels
Light Blue is a Pivot Point – Black represents the price when the report was produced
XAU/USD Intraday: Resistance level at 1985.00
Our pivot point is 1985.00
Preferable Price Action: Further downside to 1976.90 and 1972.00
Alternative Price Action: If the price gives an upside breakout of a pivot, then the price extends to 1992.60 and 1998.10.
Comment: MACD is at 50 level and Pairs below 55MA.
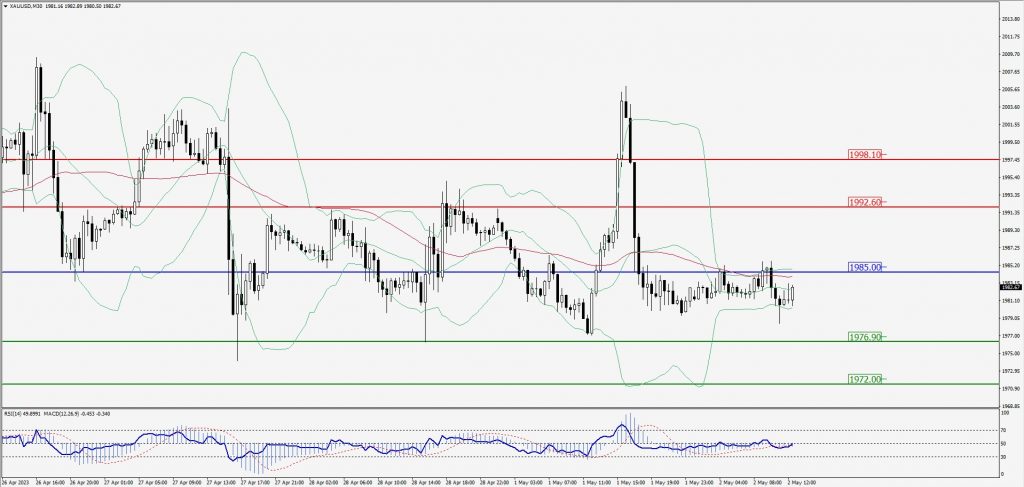
Green Lines Indicate Resistance Levels – Red Lines Indicate Support Levels
Light Blue is a Pivot Point – Black represents the price when the report was produced
Dow Jones Intraday: Trend on the downside
Our pivot point is 34,073.00
Preferable Price Action: Take sell positions below the pivot with targets at 33,882.00 & 33,754.00.
Alternative Price Action: Above 34,073.00 looks for further upside to 34,252.00 & 34,386.00.
Comment: RSI is below 50 levels and Pairs below its 20MA & 55MA.
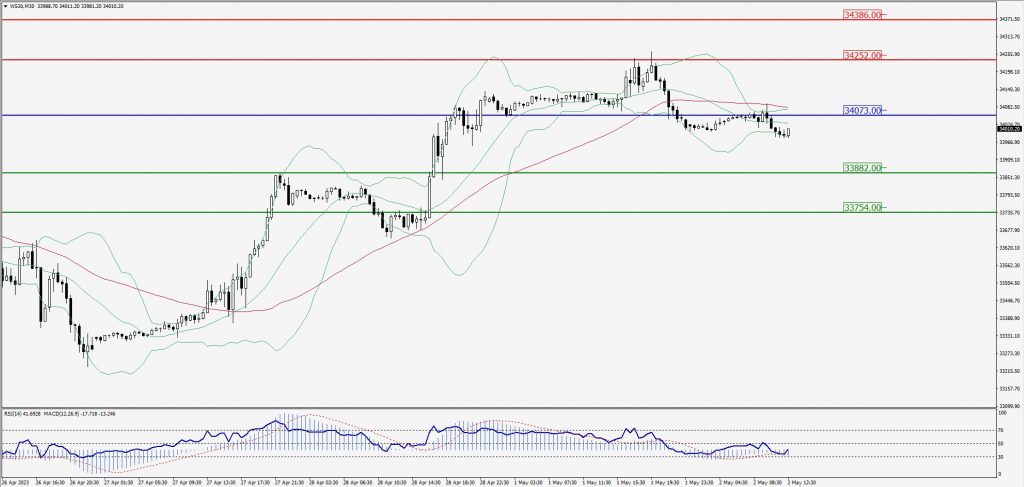
Green Lines Indicate Resistance Levels – Red Lines Indicate Support Levels
Light Blue is a Pivot Point – Black represents the price when the report was produced