Market Wrap: Stocks, Bonds, Commodities
The Nasdaq Composite slipped on Monday as investors awaited the release of a slew of corporate earnings reports from big technology companies and fresh economic data.
The Dow Jones Industrial Average rose 66.44 points to 33,875.40, the S&P 500 gain 0.09% to 4,137.04 and the Nasdaq Composite subtract 35.25 points to 12,037.20.
MSCI’s index of Asia-Pacific stocks outside Japan is decline 0.42% to 631.02 levels. The Australian index was lower by 0.11% to 7,322.00. Japanese Nikkei Index advance 0.09% today.
European stocks were negative on Tuesday, with the Stoxx Europe 50 Index fell 0.67% to 4,372.45, Germany’s DAX decline 0.29% to 15,819.65, and France’s CAC drop 0.70% to 7,520.42, and U.K.’s FTSE 100 subtract 0.36% to 7,883.64.
Benchmark 10-year U.S. Treasury fell as demand for safe assets ascend again, today 10-year bond yields are negative 1.78% to 3.4520.
Oil prices settled higher on Monday, reversing losses as investors grew optimistic that holiday travel in China would boost fuel demand in the world’s largest oil importer.
Spot Brent crude oil ascend 0.18% to $82.69 per barrel. US West Texas Intermediate crude is up 0.15% to $78.88 a barrel.
The yellow metal gold is decline 0.02% to 1,999.75 dollars per ounce.
Market Wrap: Forex
The U.S. dollar was on the back foot in early European trade Tuesday, with traders positioning for a more hawkish stance from the European Central Bank than the Federal Reserve ahead of next week’s policy-setting meetings.
Today, the U.S. dollar index measures the Greenback against a trade-weighted basket of six major currencies, which surged 0.12% to 101.190.
The Euro US Dollar (EUR/USD) is a widely traded pair that is down 0.11% today. This left the pair trading around $1.10290.
The Japanese yen was negative against the U.S. dollar on Tuesday. Today USD/JPY is slipped 0.13% to the 134.050 level.
Another commodity-related currency negative against the U.S dollar, AUD/USD fell 0.57% to 0.66580, and NZD/USD slipped 0.16% to 0.61550 level.
EUR/USD Intraday: Trend on the upside
Our pivot point is at 1.10420
Preferable Price Action: Take buy positions above pivot level with targets at 1.10700 & 1.10940 in extension.
Alternative Price Action: Below pivot looks for a further downside to 1.10160 & 1.09960.
Comment: RSI is above 50 levels and Pairs above 55MA.
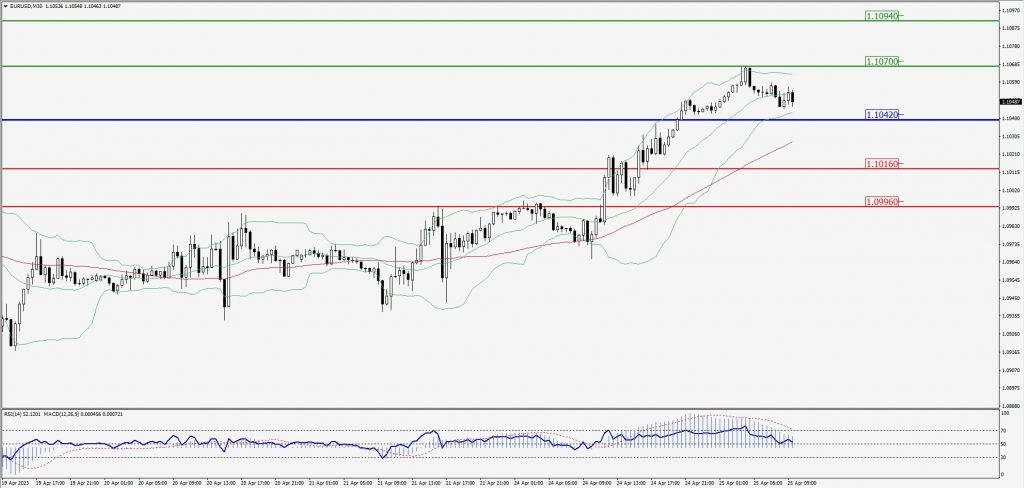
Green Lines Indicate Resistance Levels – Red Lines Indicate Support Levels
Light Blue is a Pivot Point – Black represents the price when the report was produced
GBP/USD Intraday: Trend on the downside
Our pivot point is at 1.24880
Preferable Price Action: Sell positions below pivot with targets at 1.24630 & 1.24490 in extension.
Alternative Price Action: The price above pivot would call for further upside to 1.25080 & 1.25120.
Comment: RSI is below 50 levels and Pairs below 20MA.
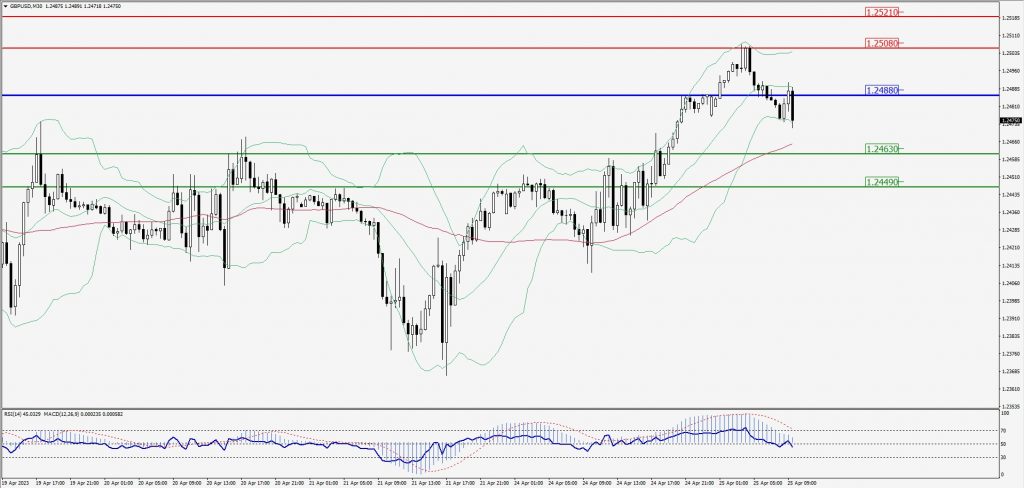
Green Lines Indicate Resistance Levels – Red Lines Indicate Support Levels
Light Blue is a Pivot Point – Black represents the price when the report was produced
USD/JPY Intraday: Trend on the upside
Our pivot point is at 134.270
Preferable Price Action: Buy position above pivot with the target at 134.540 and 134.730 in extension.
Alternative Price Action: The downside breakout of the pivot would call for 134.050 and 133.890.
Comment: MACD is above 50 level and Pairs above its 20MA & 55MA.
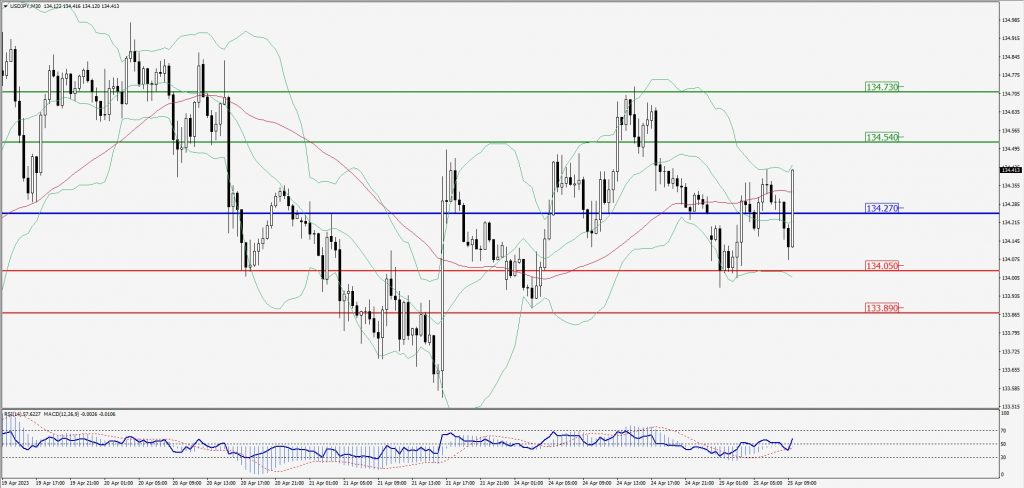
Green Lines Indicate Resistance Levels – Red Lines Indicate Support Levels
Light Blue is a Pivot Point – Black represents the price when the report was produced
AUD/USD Intraday: Resistance level at 0.66860
Our pivot point is at 0.66860
Preferable Price Action: Sell positions below pivot with targets at 0.66600 & 0.66430 in extension.
Alternative Price Action: Above pivot looks for a further upside with 0.67280 & 0.67280 as targets.
Comment: RSI is below 50 levels and Pairs below its 20MA & 55MA.
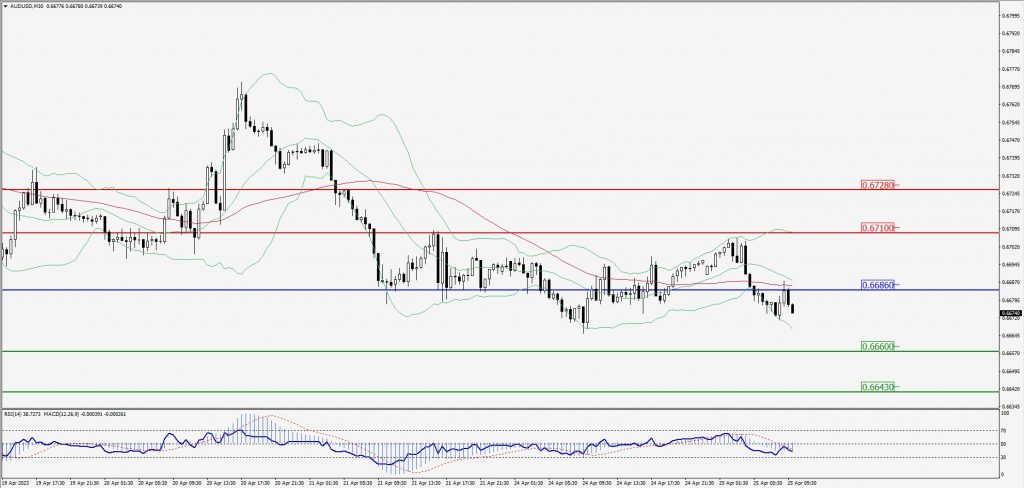
Green Lines Indicate Resistance Levels – Red Lines Indicate Support Levels
Light Blue is a Pivot Point – Black represents the price when the report was produced
CRUDEOIL Intraday: Support level at 78.58
Our pivot point is at 78.58
Preferable Price Action: Above pivot buy oil with 79.35 & 79.95 as targets.
Alternative Price Action: Sell crude below pivot with targets at 77.74 and 77.21 in extension.
Comment: MACD is positive territory and Pairs above its 20MA & 55MA.
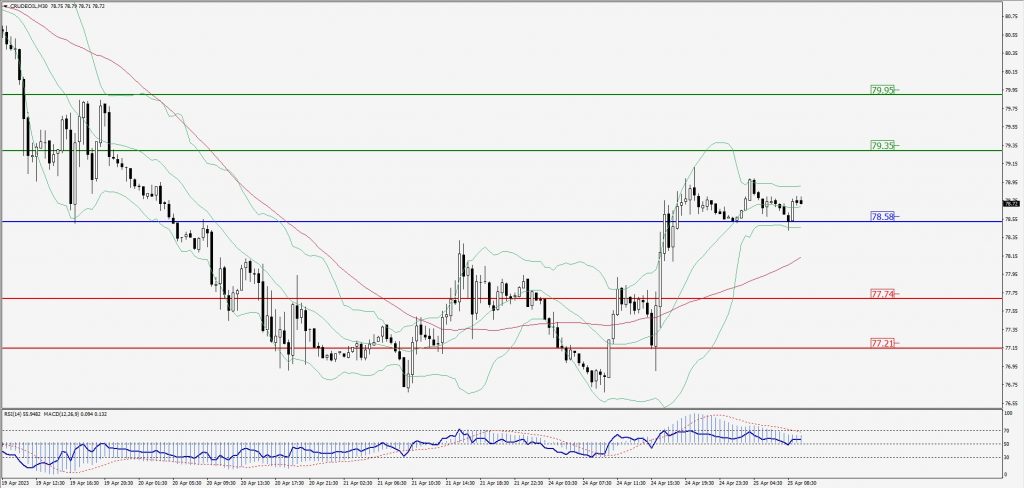
Green Lines Indicate Resistance Levels – Red Lines Indicate Support Levels
Light Blue is a Pivot Point – Black represents the price when the report was produced
XAU/USD Intraday: Trend on the upside
Our pivot point is 1991.60
Preferable Price Action: Further upside to 1999.50 and 2004.30
Alternative Price Action: If the price gives a downside breakout of a pivot, then the price extends to 1984.70 and 1980.50.
Comment: MACD is above 50 level and Pairs above 55MA.
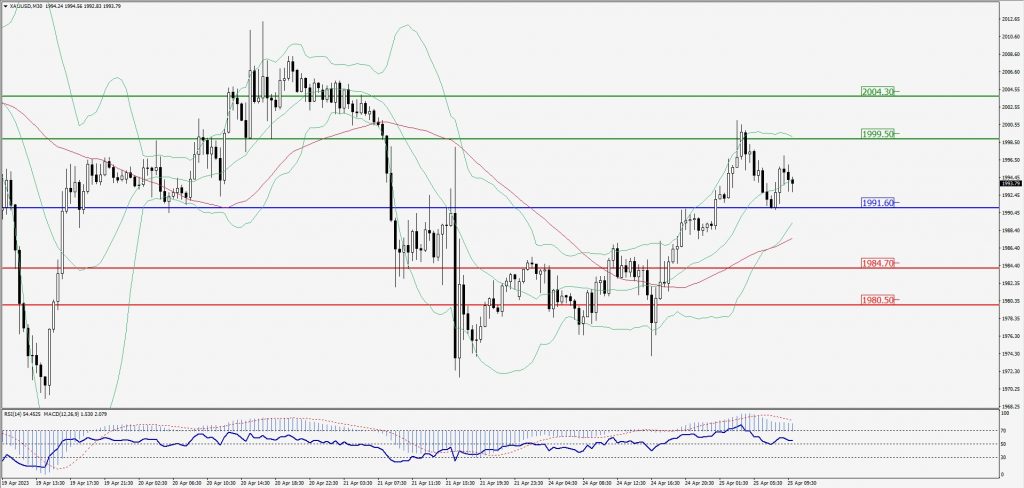
Green Lines Indicate Resistance Levels – Red Lines Indicate Support Levels
Light Blue is a Pivot Point – Black represents the price when the report was produced
Dow Jones Intraday: Trend on the downside
Our pivot point is 33,815.00
Preferable Price Action: Take sell positions below the pivot with targets at 33,737.00 & 33,695.00.
Alternative Price Action: Above 33,815.00 looks for further upside to 33,882.00 & 33,931.00.
Comment: RSI is below 50 levels and Pairs below 20MA.
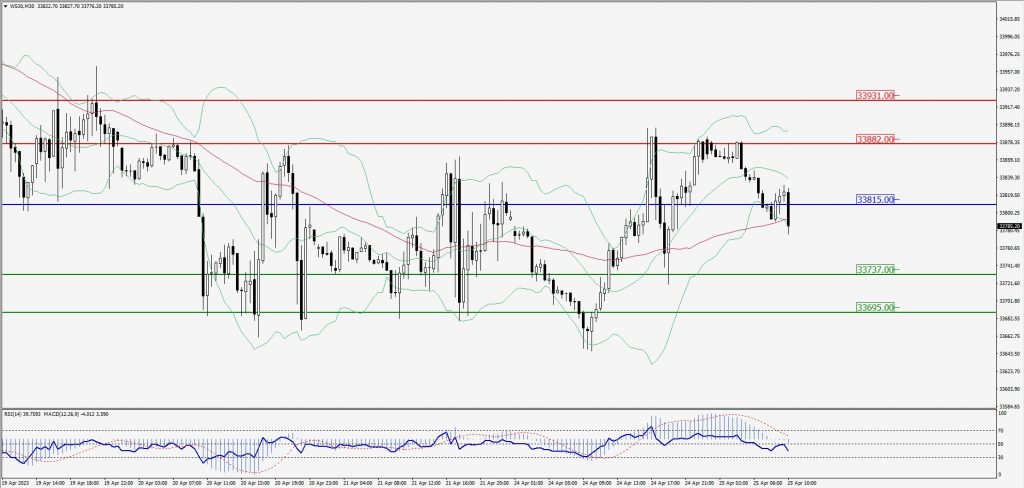
Green Lines Indicate Resistance Levels – Red Lines Indicate Support Levels
Light Blue is a Pivot Point – Black represents the price when the report was produced