Market Wrap: Stocks, Bonds, Commodities
Australia stocks were higher after the close on Monday, as gains in the A-REITs, Consumer Discretionary and IT sectors led shares higher.
The Dow Jones Industrial Average fell 143.22 points to 33,886.47, the S&P 500 lose 0.21% to 4,137.64 and the Nasdaq Composite subtract 42.81 points to 12,123.46.
MSCI’s index of Asia-Pacific stocks outside Japan is advance 0.31% to 649.60 levels. The Australian index was higher by 0.27% to 7,381.50. Japanese Nikkei Index advance 0.07% today.
European stocks were mixed on Monday, with the Stoxx Europe 50 Index fell 0.08% to 4,387.35, Germany’s DAX advance 0.24% to 15,845.85, and France’s CAC ascend 0.21% to 7,535.69, and U.K.’s FTSE 100 add 0.54% to 7,914.06.
Benchmark 10-year U.S. Treasury fell as demand for safe assets ascend again, today 10-year bond yields are negative 0.05% to 3.5200.
The International Energy Agency (IEA) also warned that deep output cuts announced by the Organization of the Petroleum Exporting Countries (OPEC) and other producers led by Russia – a group known as OPEC+ could exacerbate an oil supply deficit and hurt consumers.
Spot Brent crude oil drop 0.14% to $86.19 per barrel. US West Texas Intermediate crude is down 0.11% to $82.34 a barrel.
The yellow metal gold is advance 0.40% to 2,024.00 dollars per ounce.
Market Wrap: Forex
The U.S. dollar edged higher in early European trade Monday, bouncing off last week’s one-year low after strong earnings from some of Wall Street’s banking giants diluted concerns about the sector, raising expectations of another interest rate hike by the Federal Reserve.
Today, the U.S. dollar index measures the Greenback against a trade-weighted basket of six major currencies, which surged 0.08% to 101.380.
The Euro US Dollar (EUR/USD) is a widely traded pair that is down 0.14% today. This left the pair trading around $1.09850.
The Japanese yen was negative against the U.S. dollar on Monday. Today USD/JPY is surged 0.10% to the 133.890 level.
Another commodity-related currency negative against the U.S dollar, AUD/USD fell 0.08% to 0.67030, and NZD/USD slipped 0.03% to 0.61990 level.
EUR/USD Intraday: Trend on the upside
Our pivot point is at 1.09870
Preferable Price Action: Take buy positions above pivot level with targets at 1.10170 & 1.10360 in extension.
Alternative Price Action: Below pivot looks for a further downside to 1.09590 & 1.09420.
Comment: RSI is above 50 levels and Pairs above 20MA.
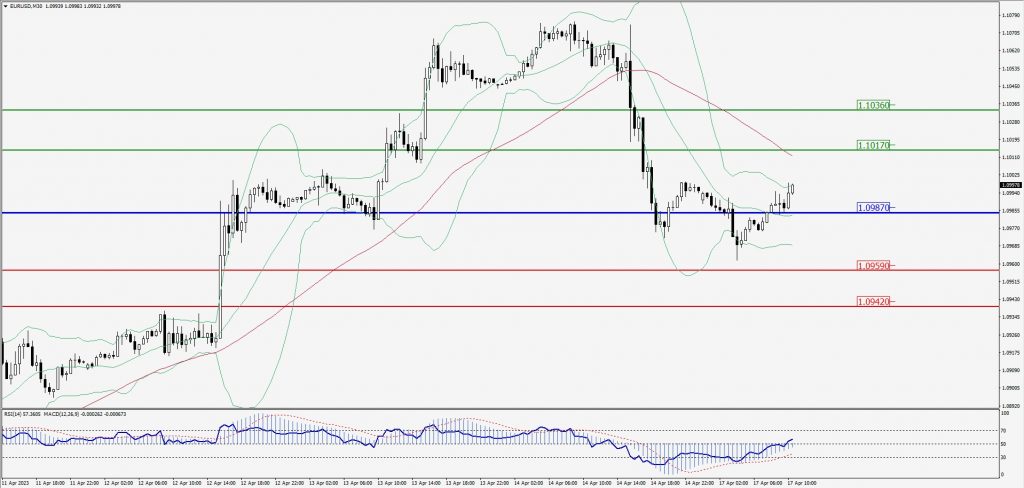
Green Lines Indicate Resistance Levels – Red Lines Indicate Support Levels
Light Blue is a Pivot Point – Black represents the price when the report was produced
GBP/USD Intraday: Trend on the upside
Our pivot point is at 1.24170
Preferable Price Action: Buy positions above pivot with targets at 1.24440 & 1.24650 in extension.
Alternative Price Action: The price below pivot would call for further downside to 1.23870 & 1.23620.
Comment: RSI is above 50 levels and Pairs above 20MA.
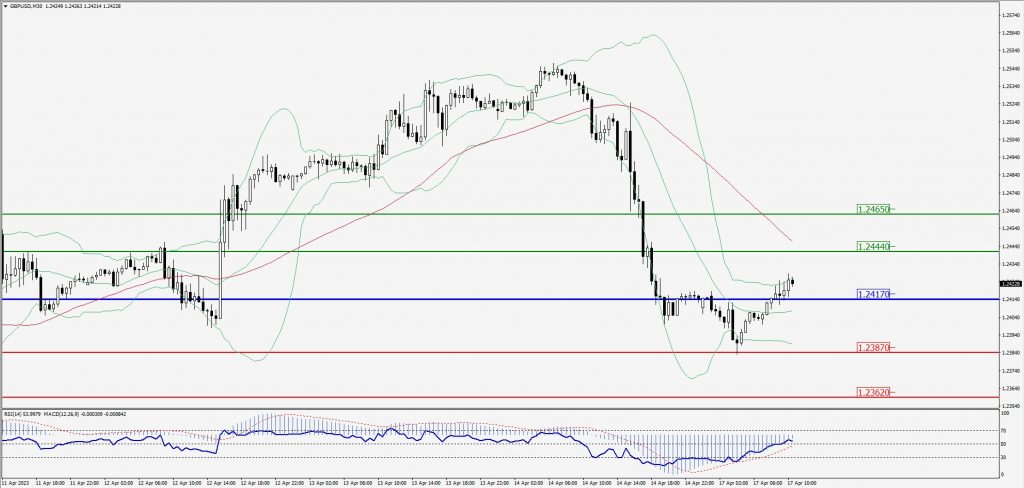
Green Lines Indicate Resistance Levels – Red Lines Indicate Support Levels
Light Blue is a Pivot Point – Black represents the price when the report was produced
USD/JPY Intraday: Major trend on the upside
Our pivot point is at 133.800
Preferable Price Action: Buy position above pivot with the target at 134.210 and 134.510 in extension.
Alternative Price Action: The downside breakout of the pivot would call for 133.460 and 133.210.
Comment: MACD is above 50 level and Pairs above its 20MA & 55MA.
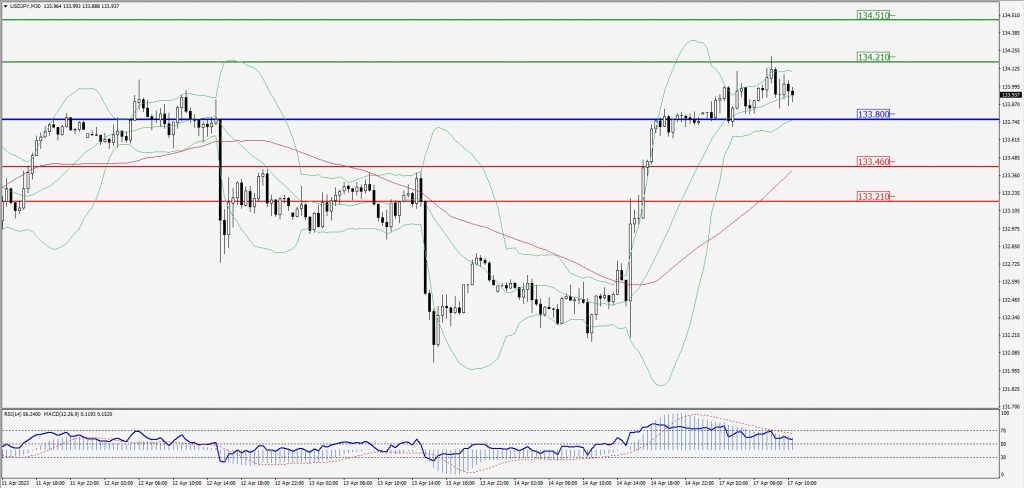
Green Lines Indicate Resistance Levels – Red Lines Indicate Support Levels
Light Blue is a Pivot Point – Black represents the price when the report was produced
AUD/USD Intraday: Support level at 0.67060
Our pivot point is at 0.67060
Preferable Price Action: Buy positions above pivot with targets at 0.67400 & 0.67610 in extension.
Alternative Price Action: Below pivot looks for a further downside with 0.66770 & 0.66580 as targets.
Comment: RSI is at 50 levels and Pairs above 20MA.
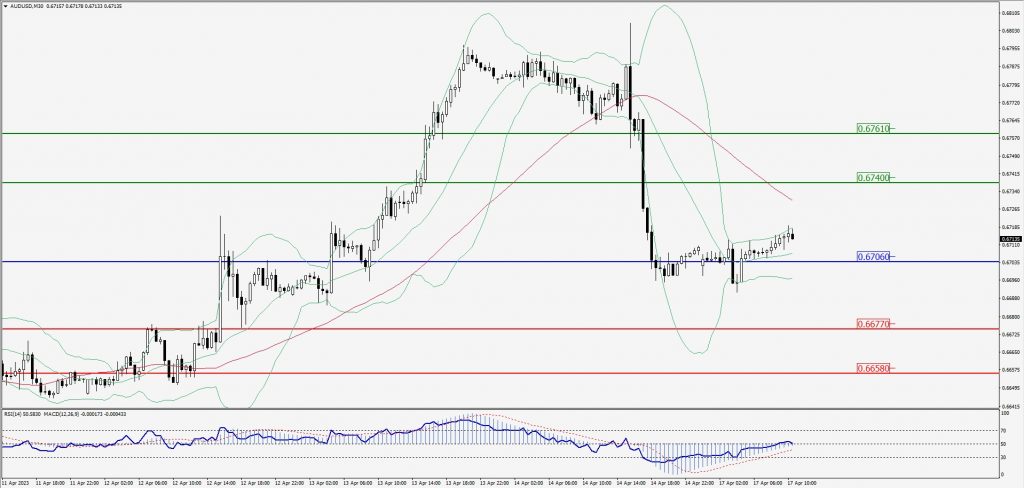
Green Lines Indicate Resistance Levels – Red Lines Indicate Support Levels
Light Blue is a Pivot Point – Black represents the price when the report was produced
CRUDEOIL Intraday: In a consolidation zone
Our pivot point is at 82.32
Preferable Price Action: Above pivot buy oil with 82.82 & 83.24 as targets.
Alternative Price Action: Sell crude below pivot with targets at 81.87 and 81.53 in extension.
Comment: MACD is flat territory.
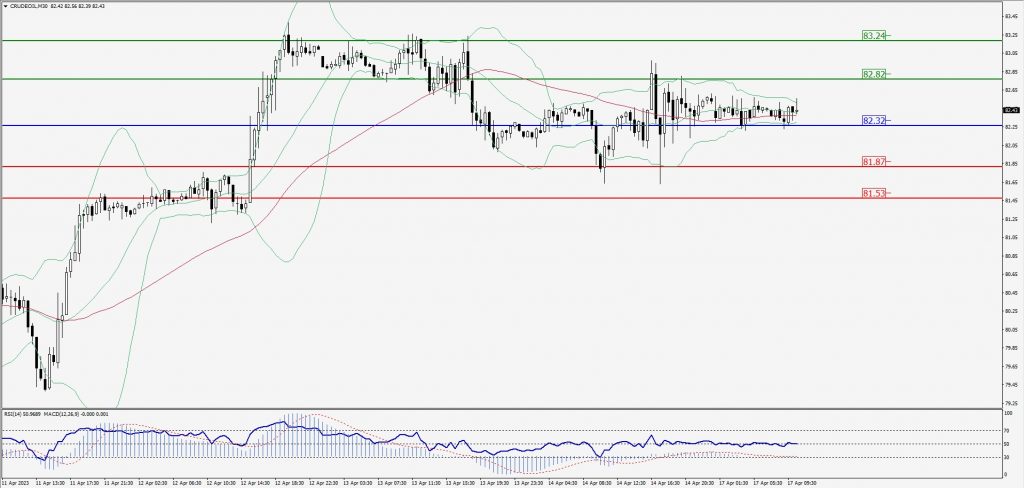
Green Lines Indicate Resistance Levels – Red Lines Indicate Support Levels
Light Blue is a Pivot Point – Black represents the price when the report was produced
XAU/USD Intraday: Trend on the upside
Our pivot point is 2008.60
Preferable Price Action: Further upside to 2019.90 and 2026.90
Alternative Price Action: If the price gives a downside breakout of a pivot, then the price extends to 1999.70 and 1992.50.
Comment: MACD is above 50 level and Pairs above 20MA.
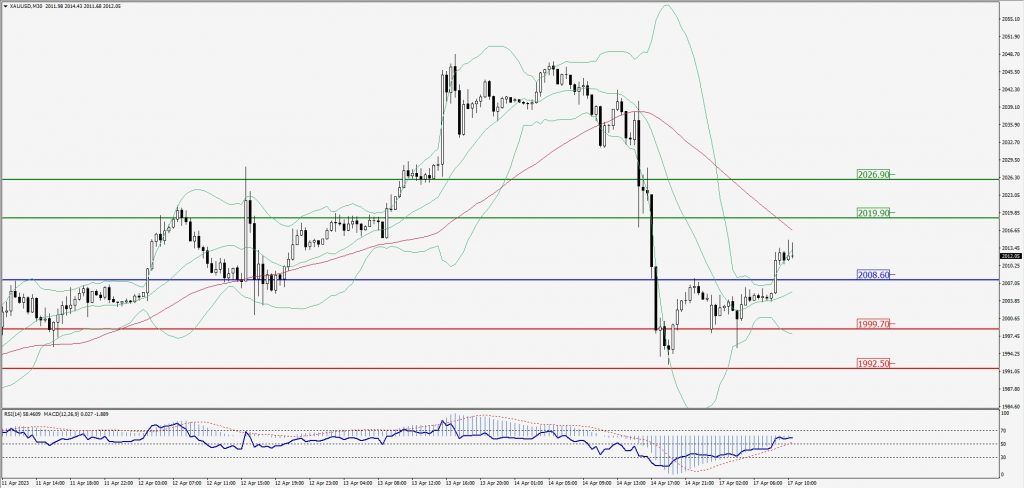
Green Lines Indicate Resistance Levels – Red Lines Indicate Support Levels
Light Blue is a Pivot Point – Black represents the price when the report was produced
Dow Jones Intraday: Resistance level at 33,960.00
Our pivot point is 33,960.00
Preferable Price Action: Take sell positions below the pivot with targets at 33,883.00 & 33,831.00.
Alternative Price Action: Above 33,960.00 looks for further upside to 34,042.00 & 34,105.00.
Comment: RSI is at 50 levels.
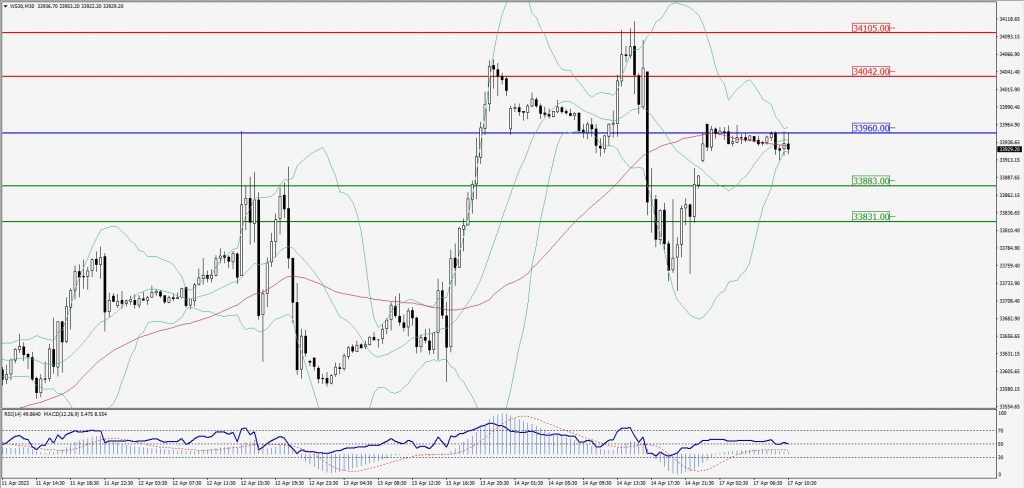
Green Lines Indicate Resistance Levels – Red Lines Indicate Support Levels
Light Blue is a Pivot Point – Black represents the price when the report was produced