Market Wrap: Stocks, Bonds, Commodities
futures tied to the Dow Jones Industrial Average traded flat, while S&P 500 and Nasdaq 100 futures inched 0.04 percent and 0.07 percent higher, respectively. Stocks ended Tuesday’s regular session mixed.
The Dow Jones Industrial Average rose 98.27 points to 33,684.79, the S&P 500 lose 0.02% to 4,108.94 and the Nasdaq Composite subtract 0.43 points to 12,031.88.
MSCI’s index of Asia-Pacific stocks outside Japan is decline 0.39% to 643.78 levels. The Australian index was higher by 0.47% to 7,343.90. Japanese Nikkei Index advance 0.57% today.
European stocks were positive on Wednesday, with the Stoxx Europe 50 Index rose 0.09% to 4,337.35, Germany’s DAX advance 0.21% to 15,686.89, and France’s CAC ascend 0.28% to 7,410.59, and U.K.’s FTSE 100 add 0.51% to 7,826.65.
Benchmark 10-year U.S. Treasury fell as demand for safe assets ascend again, today 10-year bond yields are negative 0.01% to 3.4340.
Oil prices rose about 2% on Tuesday on hopes that the Federal Reserve might ease up on its policy tightening after a key U.S. inflation report this week, though concerns remain over Chinese demand.
Spot Brent crude oil ascend 0.04% to $85.66 per barrel. US West Texas Intermediate crude is down 0.02% to $81.53 a barrel.
The yellow metal gold is advance 0.36% to 2,026.40 dollars per ounce.
Market Wrap: Forex
The U.S. dollar edged lower in early European trade Wednesday, as traders cautiously await the release of the latest U.S. inflation data which could influence future Federal Reserve monetary policy.
Today, the U.S. dollar index measures the Greenback against a trade-weighted basket of six major currencies, which slipped 0.09% to 101.790.
The Euro US Dollar (EUR/USD) is a widely traded pair that is up 0.10% today. This left the pair trading around $1.09200.
The Japanese yen was negative against the U.S. dollar on Wednesday. Today USD/JPY is surged 0.15% to the 133.860 level.
Another commodity-related currency positive against the U.S dollar, AUD/USD rose 0.13% to 0.66590, and NZD/USD surged 0.04% to 0.61920 level.
EUR/USD Intraday: Trend on the upside
Our pivot point is at 1.09210
Preferable Price Action: Take buy positions above pivot level with targets at 1.09520 & 1.09740 in extension.
Alternative Price Action: Below pivot looks for a further downside to 1.08950 & 1.08740.
Comment: RSI is above 50 levels and Pairs above 55MA.
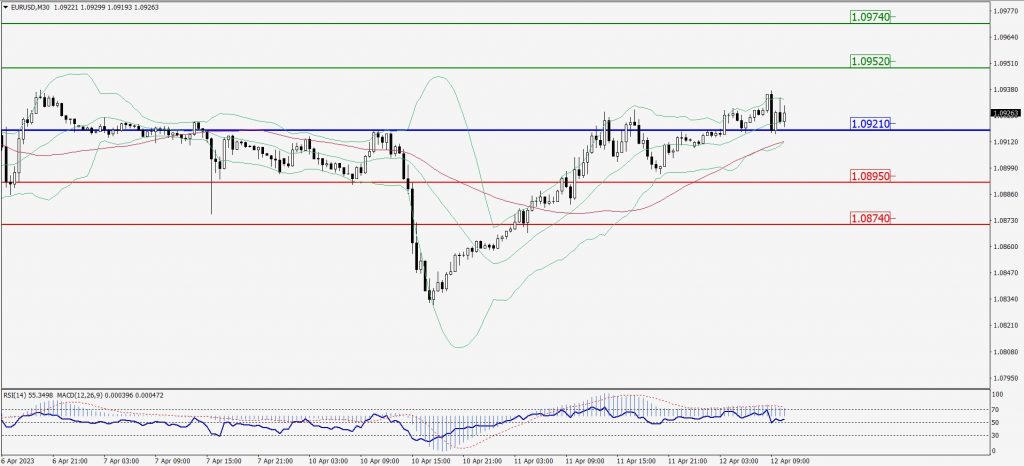
Green Lines Indicate Resistance Levels – Red Lines Indicate Support Levels
Light Blue is a Pivot Point – Black represents the price when the report was produced
GBP/USD Intraday: Resistance level at 1.24340
Our pivot point is at 1.24340
Preferable Price Action: Sell positions below pivot with targets at 1.24090 & 1.23920 in extension.
Alternative Price Action: The price above pivot would call for further upside to 1.24550 & 1.24720.
Comment: RSI is below 50 levels and Pairs below its 20MA & 55MA.
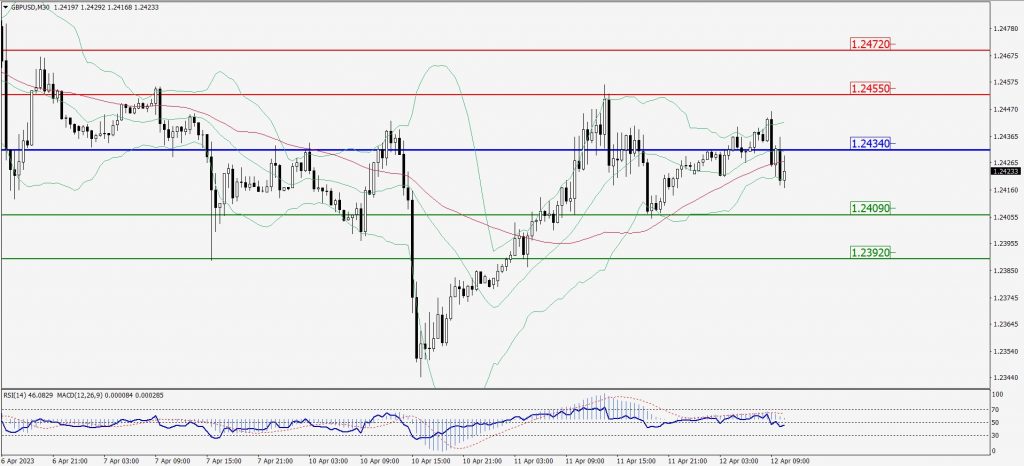
Green Lines Indicate Resistance Levels – Red Lines Indicate Support Levels
Light Blue is a Pivot Point – Black represents the price when the report was produced
USD/JPY Intraday: Trend on the upside
Our pivot point is at 133.680
Preferable Price Action: Buy position above pivot with the target at 134.250 and 134.640 in extension.
Alternative Price Action: The downside breakout of the pivot would call for 133.160 and 132.770.
Comment: MACD is above 50 level and Pairs above its 20MA & 55MA.
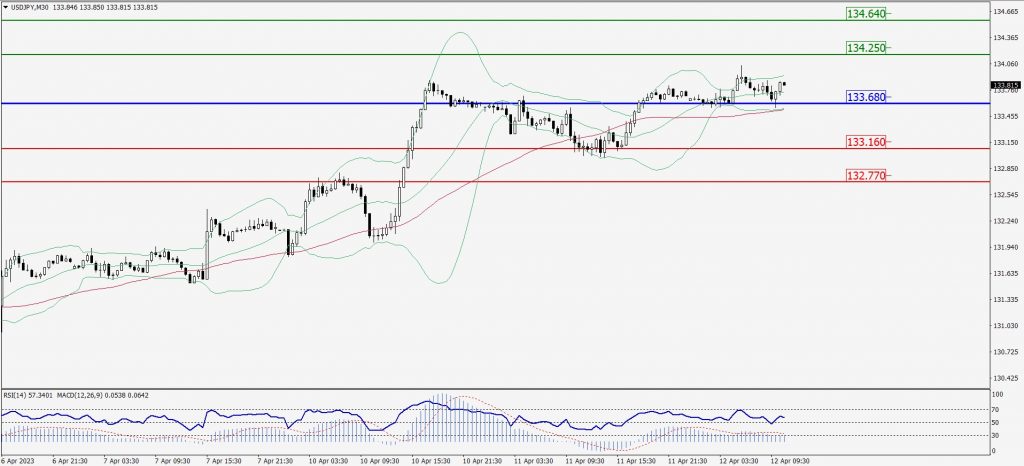
Green Lines Indicate Resistance Levels – Red Lines Indicate Support Levels
Light Blue is a Pivot Point – Black represents the price when the report was produced
AUD/USD Intraday: Trend on the upside
Our pivot point is at 0.66580
Preferable Price Action: Buy positions above pivot with targets at 0.66740 & 0.66880 in extension.
Alternative Price Action: Below pivot looks for a further downside with 0.66430 & 0.66310 as targets.
Comment: RSI is above 50 levels and Pairs above its 20MA & 55MA.
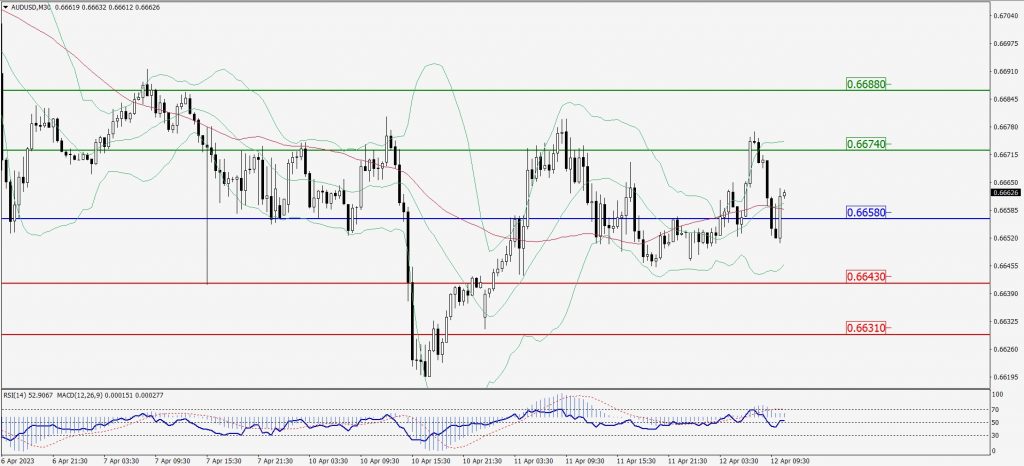
Green Lines Indicate Resistance Levels – Red Lines Indicate Support Levels
Light Blue is a Pivot Point – Black represents the price when the report was produced
CRUDEOIL Intraday: Trend on the upside
Our pivot point is at 81.31
Preferable Price Action: Above pivot buy oil with 81.97 & 82.46 as targets.
Alternative Price Action: Sell crude below pivot with targets at 80.78 and 80.32 in extension.
Comment: MACD is positive territory and Pairs above 55MA.
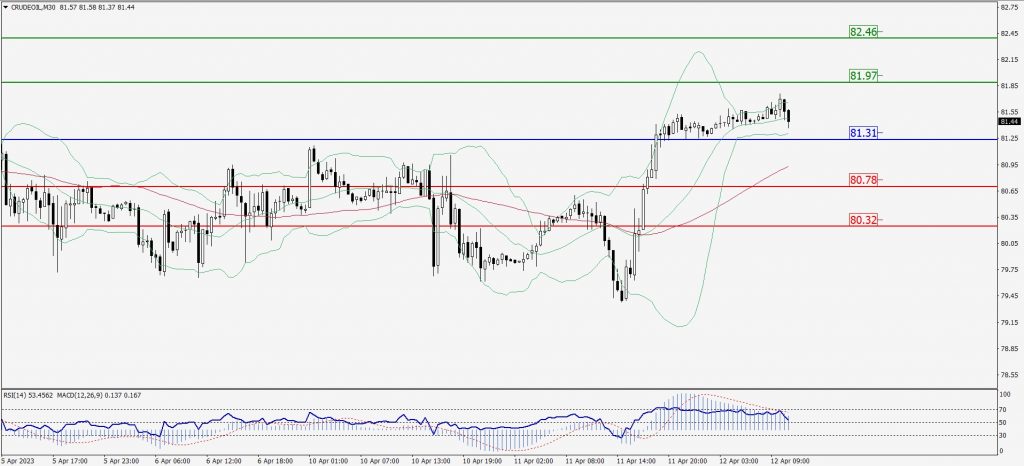
Green Lines Indicate Resistance Levels – Red Lines Indicate Support Levels
Light Blue is a Pivot Point – Black represents the price when the report was produced
XAU/USD Intraday: In a consolidation zone
Our pivot point is 2007.10
Preferable Price Action: Further upside to 2019.60 and 2027.30
Alternative Price Action: If the price gives a downside breakout of a pivot, then the price extends to 1997.40 and 1990.70.
Comment: MACD is above 50 level and Pairs above 55MA.
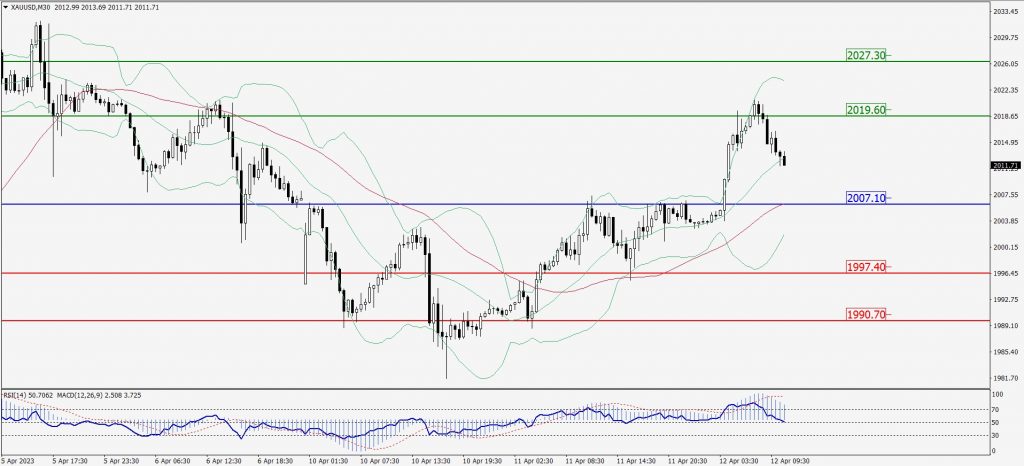
Green Lines Indicate Resistance Levels – Red Lines Indicate Support Levels
Light Blue is a Pivot Point – Black represents the price when the report was produced
Dow Jones Intraday: Support level at 33,708.00
Our pivot point is 33,708.00
Preferable Price Action: Take buy positions above the pivot with targets at 33,823.00 & 33,903.00.
Alternative Price Action: Below 33,708.00 looks for further downside to 33,614.00 & 33,542.00.
Comment: RSI is above 50 levels and Pairs above its 20MA & 55MA.
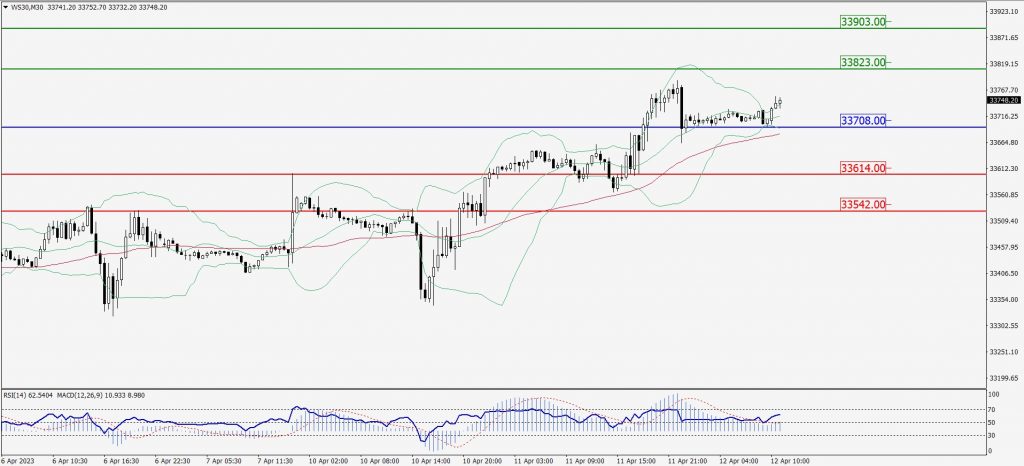
Green Lines Indicate Resistance Levels – Red Lines Indicate Support Levels
Light Blue is a Pivot Point – Black represents the price when the report was produced