Market Wrap: Stocks, Bonds, Commodities
The Dow Jones Industrial Average scored a record closing high on Tuesday for the second straight day as financial and industrial shares rallied, while the Nasdaq fell.
The S&P 500 loose (0.06%) to end at 4,793.54 points, while the Nasdaq Composite lost 210.10 points (1.33%) to 15,622.70. The Dow Jones Industrial Average rose 214.59 points (0.59%) to 36,799.65.
MSCI’s index of Asia-Pacific stocks outside Japan slipped 0.96%, to 783.25 levels. Australian index fallen 0.32% to 7,565.80. Japanese Nikkei Index gains 0.10% to 29,332.16.
European stocks were positive on Wednesday, with the Stoxx Europe 50 Index plus 0.20% to 4,376.35, Germany’s DAX gained 0.23% to 16.189.70, and France’s CAC surged 0.20% to 7,331.94, and U.K.’s FTSE 100 down 0.13% to 7,495.70.
Benchmark 10-year U.S. Treasury drop as demand for safe assets gain again, today 10-year bond yields retreat 1.33% to 1.644.
Global benchmark Brent crude jumped on Thursday to $80 a barrel, its highest since November, as OPEC+ agreed to stick to its planned increase for February based on indications that the Omicron coronavirus variant would have only a mild impact on demand.
Spot Brent crude oil gained 0.4% to $80.03 per barrel. US West Texas Intermediate crude flat to $76.98 a barrel.
The yellow metal gold is gained 0.80% to 1,815.40 dollars per ounce.
Market Wrap: Forex
The U.S. dollar rose for a fifth straight day against the Japanese yen on Wednesday, hitting a five-year high as investors viewed the Omicron variant as not likely to derail the global economy or delay the Federal Reserve’s expected rate hikes.
Today, the U.S. dollar index measures the greenback against a trade-weighted basket of six major currencies, which fell 0.07% to 96.190.
The Euro US Dollar (EUR/USD) is a widely traded pair that is rising today. This left the pair trading around $1.13060.
The Japanese yen fell against the U.S. dollar on Wednesday as the stock pushes lower. Today US/JPY is rose 0.19% to 115.930 level.
Another commodity-related currency lower against the U.S dollar, AUD/USD drop 0.04% to 0.72350, and NZD/USD fell 0.18% to 0.68000 level.
EUR/USD Intraday: Trend on the Downside
Our pivot point is at 1.13190
Preferable Price Action: Take Short positions below pivot level with targets at 1.12590 & 1.12230 in extension.
Alternative Price Action: Above pivot looks for a further Upside to 1.13790 & 1.14130.
Comment: RSI above 50 levels.
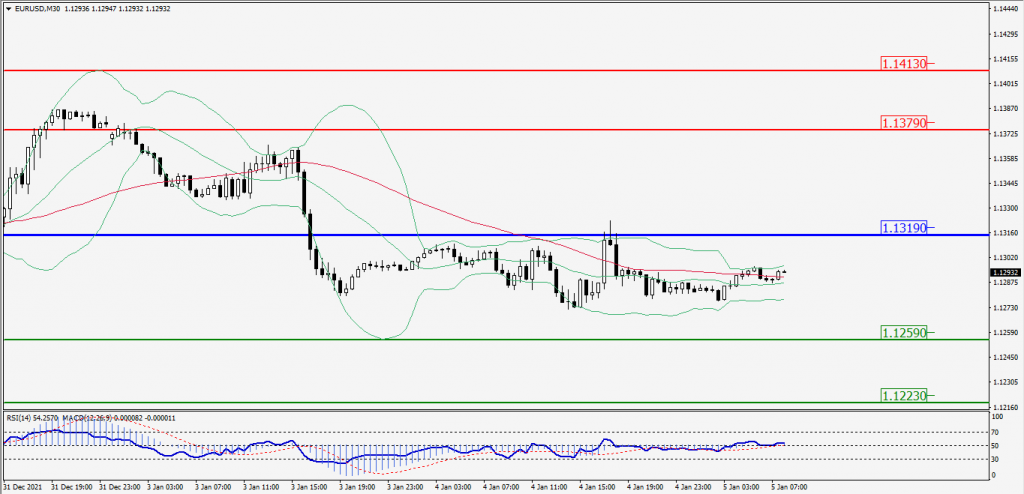
Green Lines Indicate Resistance Levels – Red Lines Indicates Support Levels
Light Blue is a Pivot Point – Black represents the price when the report was produced
GBP/USD Intraday: In a Consolidation Zone
Our pivot point is at 1.34990
Preferable Price Action: Buy positions Above pivot with targets at 1.35660 & 1.36060 in extension.
Alternative Price Action: The price Below pivot would call for further Downside to 1.34330 & 1.33930.
Comment: Pair Above 55MA and RSI at 50 levels.
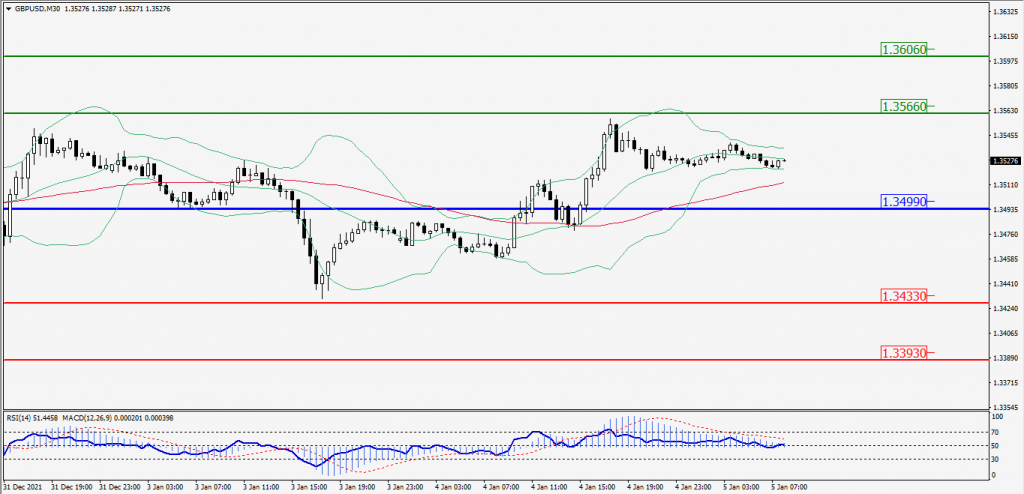
Green Lines Indicate Resistance Levels – Red Lines Indicates Support Levels
Light Blue is a Pivot Point – Black represents the price when the report was produced
USD/JPY Intraday: Support at 115.830
Our pivot point is at 115.830
Preferable Price Action: Buy position Above pivot with the target at 116.430 and 116.760 in extension.
Alternative Price Action: The Downside breakout of the pivot would call for 115.230 and 114.900.
Comment: Price below 20MA and MACD in negative territory.
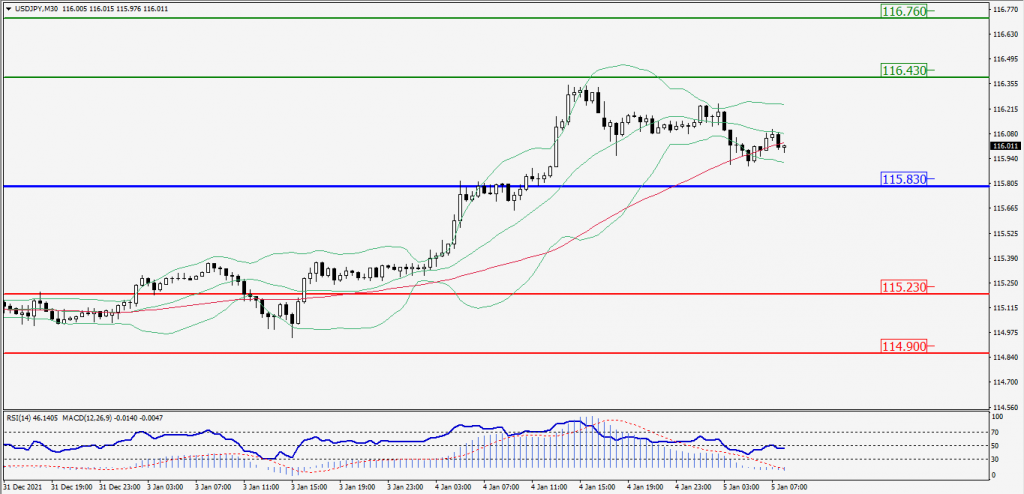
Green Lines Indicate Resistance Levels – Red Lines Indicates Support Levels
Light Blue is a Pivot Point – Black represents the price when the report was produced
AUD/USD Intraday: Major Resistance at 0.72530
Our pivot point is at 0.72530
Preferable Price Action: Sell Positions Below pivot with targets at 0.72030 & 0.71760 in extension.
Alternative Price Action: Above pivot looks for a further Upside with 0.73030 & 0.73300 as targets.
Comment: Pair below 20MA and RSI below 50 levels.
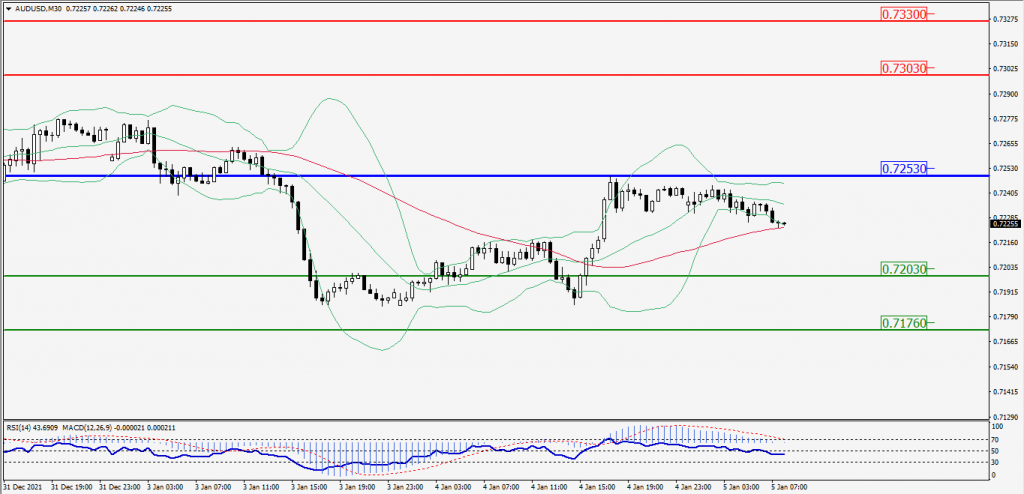
Green Lines Indicate Resistance Levels – Red Lines Indicates Support Levels
Light Blue is a Pivot Point – Black represents the price when the report was produced
CRUDEOIL Intraday: Support at 76.30
Our pivot point is at 76.30
Preferable Price Action: Above pivots Buy Oil with 77.60 & 78.30 as targets.
Alternative Price Action: Sell crude Below pivot with targets at 75.00 and 74.30 in extension.
Comment: Price above 55MA and MACD is in the flat territory.
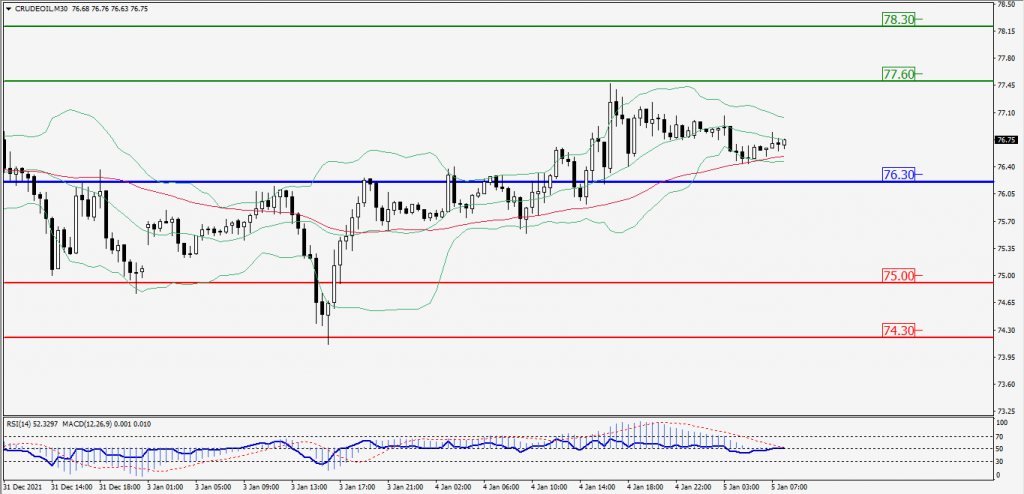
Green Lines Indicate Resistance Levels – Red Lines Indicates Support Levels
Light Blue is a Pivot Point – Black represents the price when the report was produced
XAU/USD Intraday: In a Consolidation Zone
Our pivot point is 1809.00
Preferable Price Action: Further Upside to 1823.00 and 1833.00.
Alternative Price Action: If the price gives a Downside breakout of a pivot, then the price extends to 1796.00 and 1786.00.
Comment: MACD in Positive territory and price Above its 20MA & 55MA.
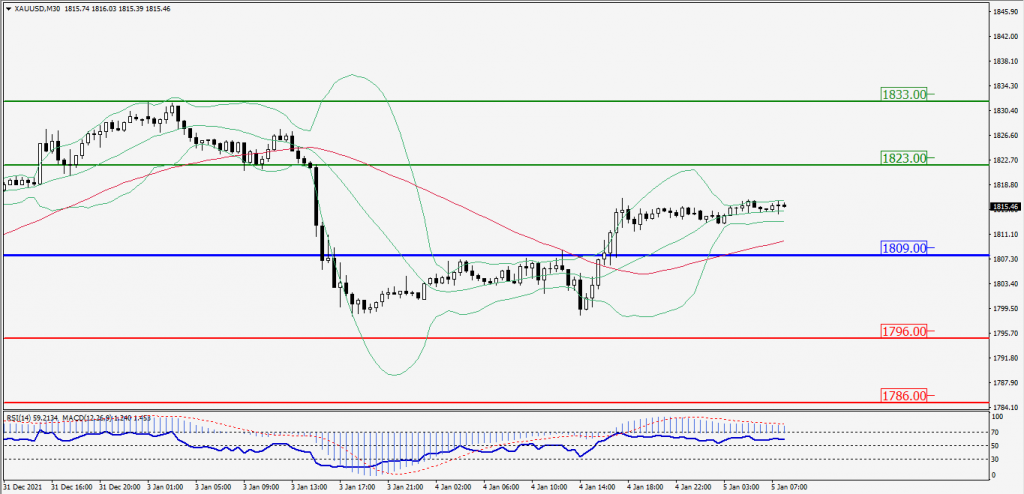
Green Lines Indicate Resistance Levels – Red Lines Indicates Support Levels
Light Blue is a Pivot Point – Black represents the price when the report was produced
Dow Jones Intraday: Trend on the Upside
Our pivot point is 36,620.00
Preferable Price Action: Take Long positions Above pivot with targets at 36,830.00 & 36,950.00.
Alternative Price Action: Above 36,620.00 looks for further Downside to 36,410.00 & 36,290.00.
Comment: RSI below 50 levels.
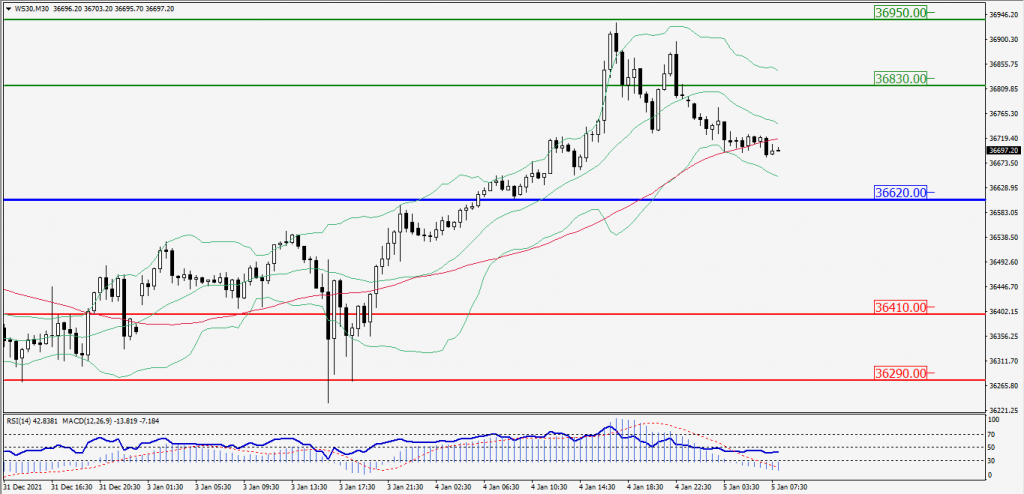
Green Lines Indicate Resistance Levels – Red Lines Indicates Support Levels
Light Blue is a Pivot Point – Black represents the price when the report was produced