Market Wrap: Stocks, Bonds, Commodities
US stocks fell sharply on Thursday with the Nasdaq plunging more than 3% in its biggest one-day percentage drop since February, after U.S. Federal Reserve meeting minutes signaled the central bank may raise interest rates sooner than expected.
The S&P 500 loose (1.94%) to end at 4,700.58 points, while the Nasdaq Composite lost 522.50 points (3.34%) to 15,100.20. The Dow Jones Industrial fall 392.54 points (1.07%) to 36,407.11.
MSCI’s index of Asia-Pacific stocks outside Japan slipped 0.82%, to 775.02 levels. Australian index fell 2.74% to 7,358.30. Japanese Nikkei Index loss 2.88% to 28,487.87.
European stocks were negative on Thursday, with the Stoxx Europe 50 Index left 1.85% to 4,310.75, Germany’s DAX stair down 1.41% to 16,042.73, and France’s CAC lose 1.72% to 7,249.57, and U.K.’s FTSE 100 down 1.00% to 7,441.51.
Benchmark 10-year U.S. Treasury Climb as demand for safe assets gain again, today 10-year bond yields retreat 1.47% to 1.728.
Oil prices lost ground on Thursday, easing from their highest levels in more than a month as OPEC+ producers stuck to a plan to boost production and US fuel stockpiles surged amid declining demand.
Spot Brent crude oil drain 0.75% to $80.19 per barrel. US West Texas Intermediate crude down to $77.28 a barrel.
The yellow metal gold is negative 1.23% to 1,802.60 dollars per ounce.
Market Wrap: Forex
The dollar hovered near a five-year high to the yen on Thursday, supported by a surge in U.S. Treasury yields on rising bets for a Federal Reserve rate hike by March.
Today, the U.S. dollar index measures the greenback against a trade-weighted basket of six major currencies, which surged 0.19% to 96.360.
The Euro US Dollar (EUR/USD) is a widely traded pair that is fell today. This left the pair trading around $1.12930.
The Japanese yen fell against the U.S. dollar on Thursday as the stock pushes lower. Today US/JPY is loos 0.16% to 115.920 level.
Another commodity-related currency lower against the U.S dollar, AUD/USD dropped 0.78% to 0.71630, and NZD/USD fell 0.69% to 0.67450 level.
EUR/USD Intraday: Support at 1.12930
Our pivot point is at 1.12930
Preferable Price Action: Take Long positions above pivot level with targets at 1.13360 & 1.13660 in extension.
Alternative Price Action: Below pivot looks for a further Downside to 1.12500 & 1.12200.
Comment: RSI Below 50 levels.
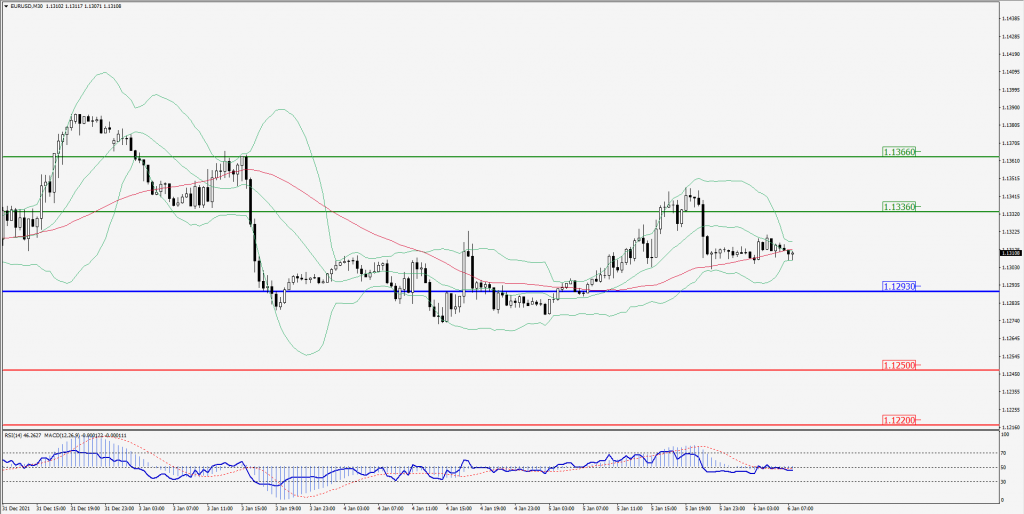
Green Lines Indicate Resistance Levels – Red Lines Indicates Support Levels
Light Blue is a Pivot Point – Black represents the price when the report was produced
GBP/USD Intraday: Resistance at 1.35430
Our pivot point is at 1.35430
Preferable Price Action: Sell positions Below pivot with targets at 1.35060 & 1.34830 in extension.
Alternative Price Action: The price Above pivot would call for further Upside to 1.35800 & 1.36030.
Comment: Pair Below its 20MA & 55MA and RSI below 50 levels.
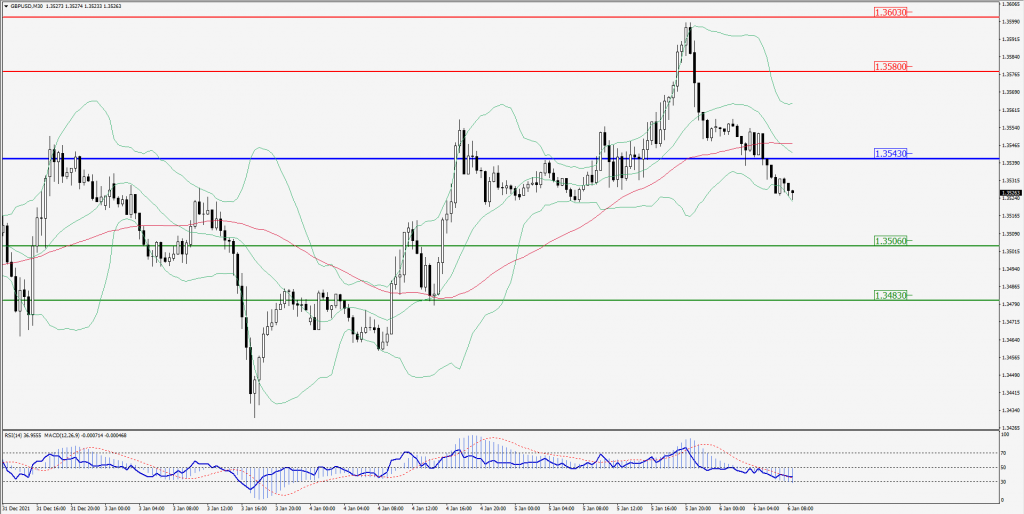
Green Lines Indicate Resistance Levels – Red Lines Indicates Support Levels
Light Blue is a Pivot Point – Black represents the price when the report was produced
USD/JPY Intraday: Support at 115.600
Our pivot point is at 115.600
Preferable Price Action: Buy position Above pivot with the target at 116.200 and 116.530 in extension.
Alternative Price Action: The Downside breakout of the pivot would call for 115.000 and 114.660.
Comment: Price below its 20MA & 55MA and MACD in negative territory.
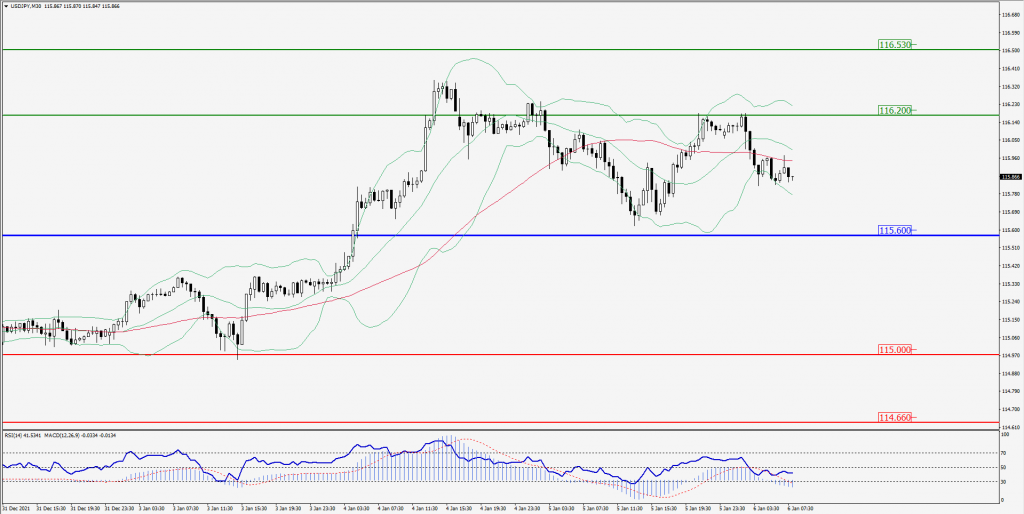
Green Lines Indicate Resistance Levels – Red Lines Indicates Support Levels
Light Blue is a Pivot Point – Black represents the price when the report was produced
AUD/USD Intraday: Major Resistance at 0.71990
Our pivot point is at 0.71990
Preferable Price Action: Sell Positions Below pivot with targets at 0.71490 & 0.71230 in extension.
Alternative Price Action: Above pivot looks for a further Upside with 0.72490 & 0.72760 as targets.
Comment: Pair below its 20MA & 55MA and RSI below 50 levels.
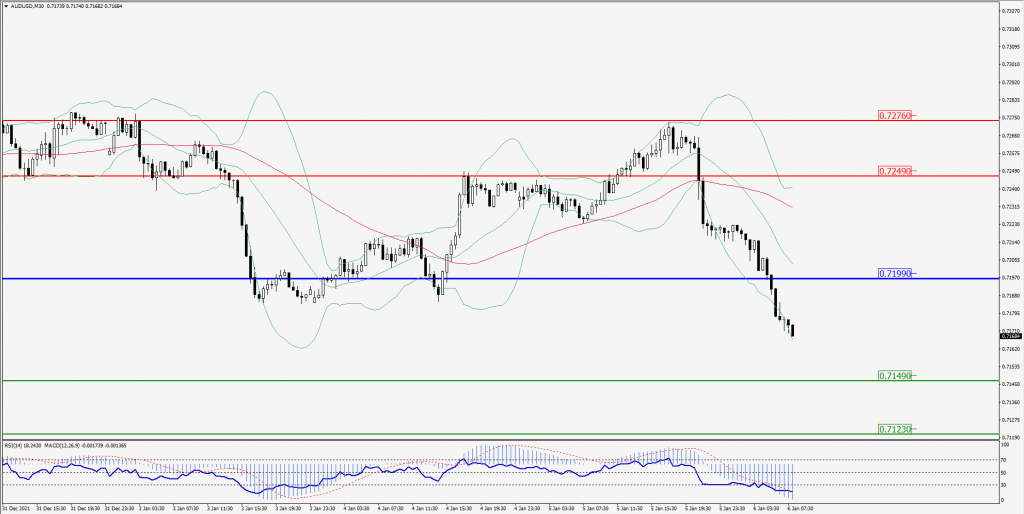
Green Lines Indicate Resistance Levels – Red Lines Indicates Support Levels
Light Blue is a Pivot Point – Black represents the price when the report was produced
CRUDEOIL Intraday: Support at 76.30
Our pivot point is at 76.30
Preferable Price Action: Above pivots Buy Oil with 77.60 & 78.30 as targets.
Alternative Price Action: Sell crude Below pivot with targets at 75.00 and 74.30 in extension.
Comment: Price Above 20MA and MACD is in the negative territory.
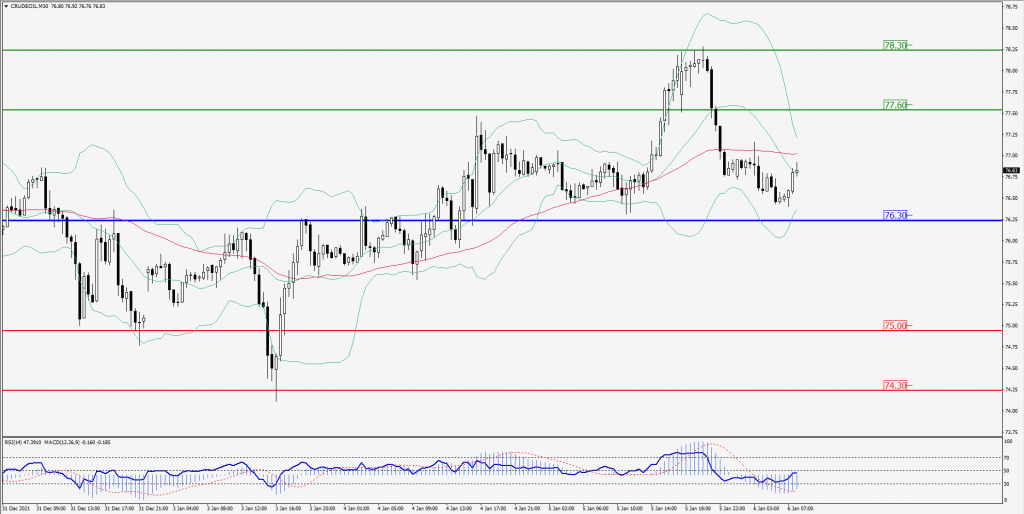
Green Lines Indicate Resistance Levels – Red Lines Indicates Support Levels
Light Blue is a Pivot Point – Black represents the price when the report was produced
XAU/USD Intraday: Major Down Trend
Our pivot point is 1810.60
Preferable Price Action: Further Downside to 1793.30 and 1786.30.
Alternative Price Action: If the price gives an Upside breakout of a pivot, then the price extends to 1826.80 and 1833.80.
Comment: MACD is in positive territory and price Below its 20MA & 55MA.
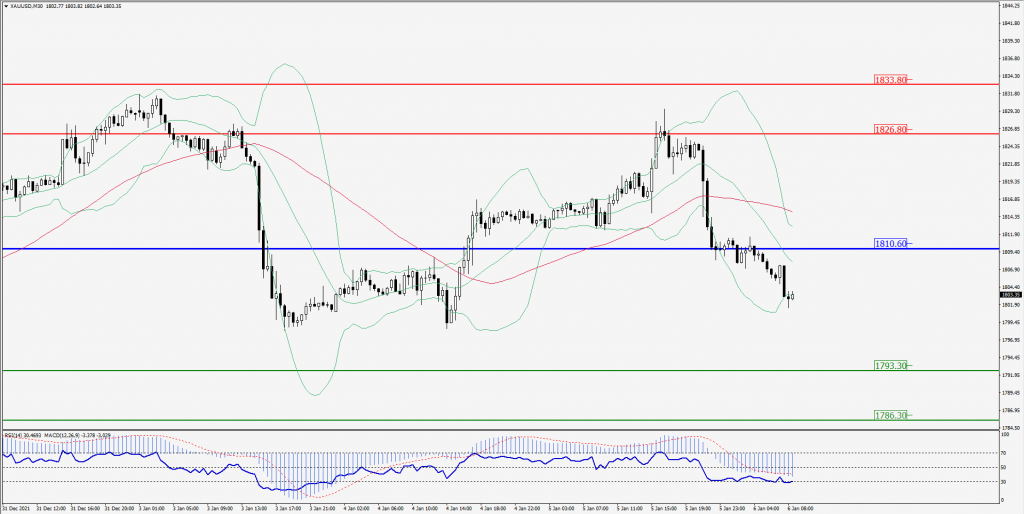
Green Lines Indicate Resistance Levels – Red Lines Indicates Support Levels
Light Blue is a Pivot Point – Black represents the price when the report was produced
Dow Jones Intraday: Trend on the major Downside
Our pivot point is 36,530.00
Preferable Price Action: Take Short positions Below pivot with targets at 36,230.00 & 36,060.00.
Alternative Price Action: Above 36,530.00 looks for further Upside to 36,830.00 & 36,990.00.
Comment: RSI below 50 levels and price Below its 20MA & 55MA.
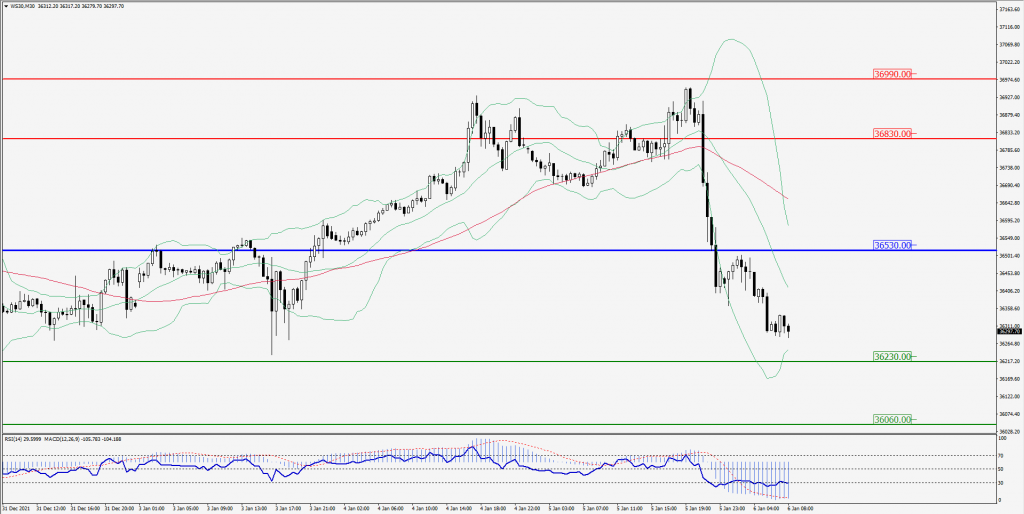
Green Lines Indicate Resistance Levels – Red Lines Indicates Support Levels
Light Blue is a Pivot Point – Black represents the price when the report was produced