Market Wrap: Stocks, Bonds, Commodities
Wall Street gyrated to end sharply lower on Wednesday after the U.S. Federal Reserve delivered a widely expected 25 basis point policy hike, while hinting that it was on the verge of pausing future increases in view of recent turmoil in the financial sector.
The Dow Jones Industrial Average fell 530.49 points to 32,030.11, the S&P 500 lose 1.65% to 3,936.97 and the Nasdaq Composite subtract 190.15 points to 11,669.96.
MSCI’s index of Asia-Pacific stocks outside Japan is advance 1.62% to 636.83 levels. The Australian index was lower by 0.67% to 6,968.60. Japanese Nikkei Index decline 0.17% today.
European stocks were positive on Thursday, with the Stoxx Europe 50 Index rose 0.34% to 4,195.75, Germany’s DAX advance 0.14% to 15,216.19, and France’s CAC ascend 0.26% to 7,131.12, and U.K.’s FTSE 100 add 0.41% to 7,566.84.
Benchmark 10-year U.S. Treasury fell as demand for safe assets ascend again, today 10-year bond yields are negative 1.67% to 3.4420.
Oil prices fell on Thursday following three sessions of gains, after U.S. Federal Reserve Chair Jerome Powell re-stated his commitment to curbing inflation, including the possibility of more interest rate rises.
Spot Brent crude oil drop 0.69% to $76.16 per barrel. US West Texas Intermediate crude is down 0.80% to $70.31 a barrel.
The yellow metal gold is advance 1.73% to 1,983.20 dollars per ounce.
Market Wrap: Forex
The dollar was under pressure near seven-week lows on Thursday after the U.S. Federal Reserve sounded close to calling time on interest rate hikes, which markets think are more or less over.
Today, the U.S. dollar index measures the Greenback against a trade-weighted basket of six major currencies, which slipped 0.36% to 101.590.
The Euro US Dollar (EUR/USD) is a widely traded pair that is up 0.60% today. This left the pair trading around $1.09210.
The Japanese yen was negative against the U.S. dollar on Thursday. Today USD/JPY is slipped 0.57% to the 130.60 level.
Another commodity-related currency positive against the U.S dollar, AUD/USD rose 1.06% to 0.67530, and NZD/USD surged 1.13% to 0.62900 level.
EUR/USD Intraday: Major trend on the upside
Our pivot point is at 1.09080
Preferable Price Action: Take buy positions above pivot level with targets at 1.09860 & 1.10390 in extension.
Alternative Price Action: Below pivot looks for a further downside to 1.08390 & 1.07880.
Comment: RSI is above 50 levels and Pairs above its 20MA & 55MA.
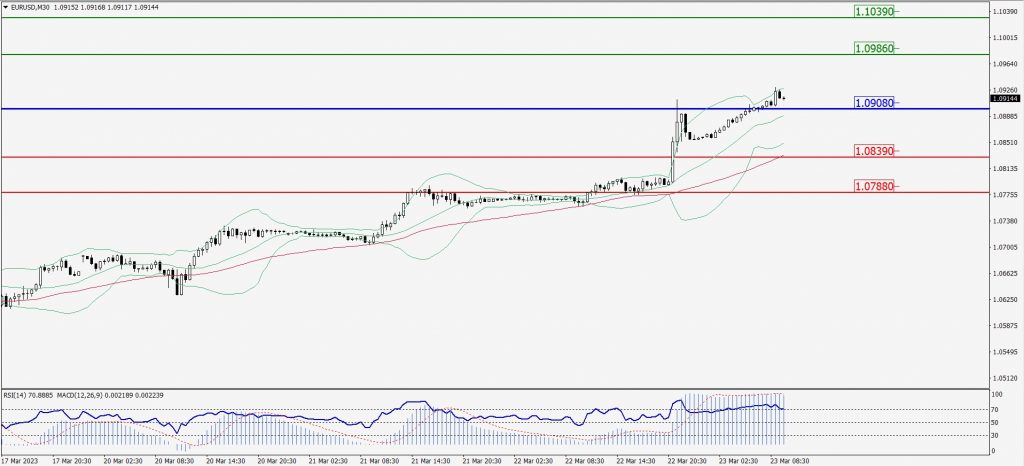
Green Lines Indicate Resistance Levels – Red Lines Indicate Support Levels
Light Blue is a Pivot Point – Black represents the price when the report was produced
GBP/USD Intraday: Trend on the upside
Our pivot point is at 1.23050
Preferable Price Action: Buy positions above pivot with targets at 1.23580 & 1.23970 in extension.
Alternative Price Action: The price below pivot would call for further downside to 1.22600 & 1.22290.
Comment: RSI is above 50 levels and Pairs above its 20MA & 55MA.
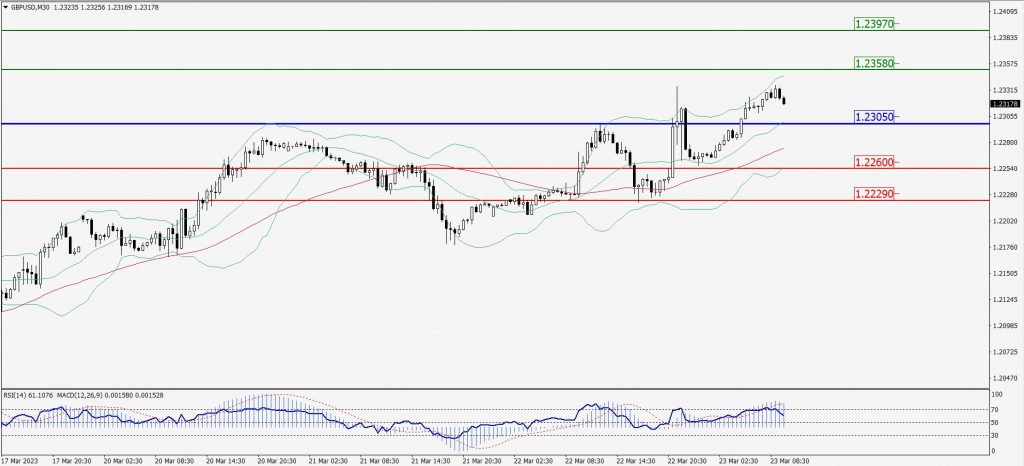
Green Lines Indicate Resistance Levels – Red Lines Indicate Support Levels
Light Blue is a Pivot Point – Black represents the price when the report was produced
USD/JPY Intraday: Trend on the downside
Our pivot point is at 131.160
Preferable Price Action: Sell position below pivot with the target at 130.620 and 130.270 in extension.
Alternative Price Action: The upside breakout of the pivot would call for 131.650 and 132.020.
Comment: MACD is below 50 level and Pairs below its 20MA & 55MA.
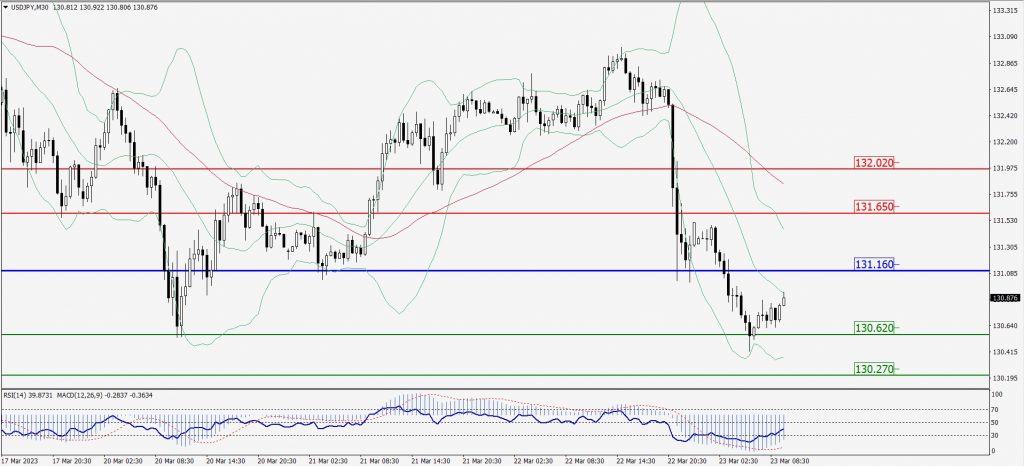
Green Lines Indicate Resistance Levels – Red Lines Indicate Support Levels
Light Blue is a Pivot Point – Black represents the price when the report was produced
AUD/USD Intraday: Trend on the upside
Our pivot point is at 0.67360
Preferable Price Action: Buy positions above pivot with targets at 0.67590 & 0.67740 in extension.
Alternative Price Action: Below pivot looks for a further downside with 0.67160 & 0.67020 as targets.
Comment: RSI is above 50 levels and pairs above its 20MA & 55MA.
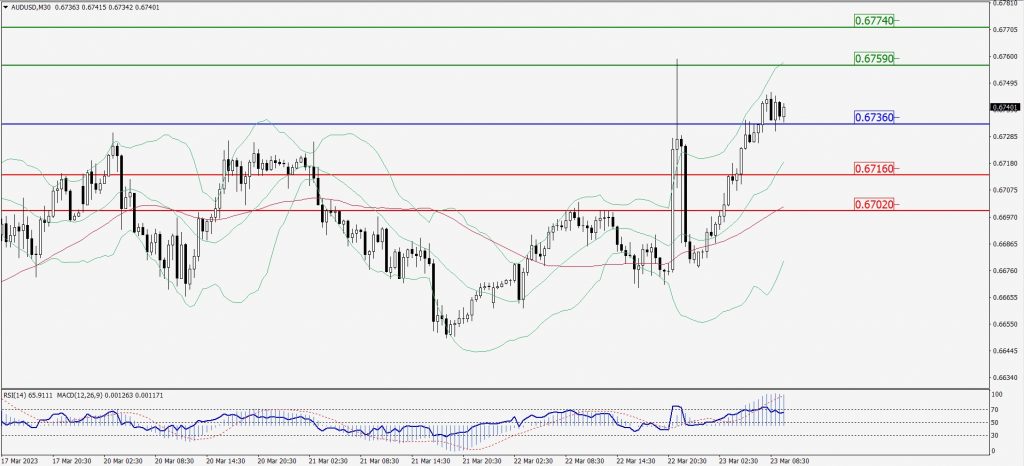
Green Lines Indicate Resistance Levels – Red Lines Indicate Support Levels
Light Blue is a Pivot Point – Black represents the price when the report was produced
CRUDEOIL Intraday: Support level at 70.18
Our pivot point is at 70.18
Preferable Price Action: Above pivot buy oil with 71.49 & 72.40 as targets.
Alternative Price Action: Sell crude below pivot with targets at 69.09 and 68.26 in extension.
Comment: MACD is positive territory and Pairs above its 20MA & 55MA.
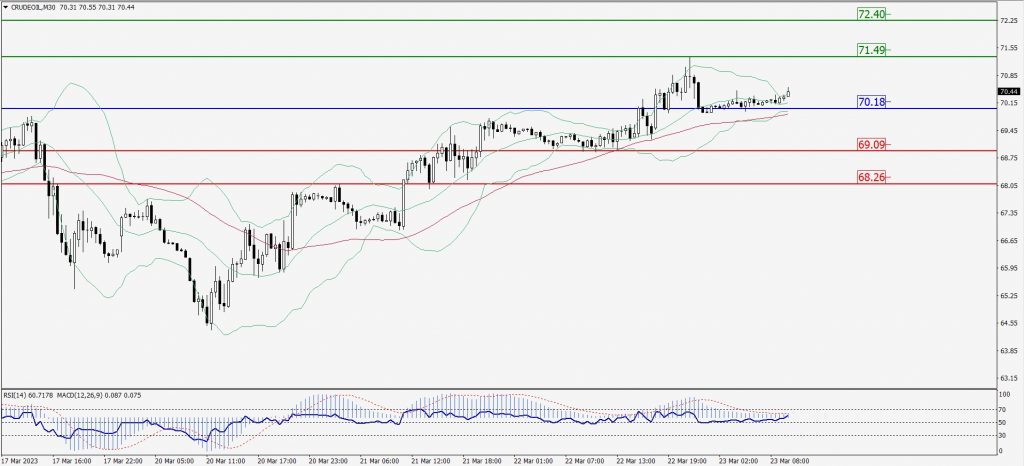
Green Lines Indicate Resistance Levels – Red Lines Indicate Support Levels
Light Blue is a Pivot Point – Black represents the price when the report was produced
XAU/USD Intraday: Trend on the upside
Our pivot point is 1974.70
Preferable Price Action: Further upside to 1987.60 and 1996.90
Alternative Price Action: If the price gives a downside breakout of a pivot, then the price extends to 1963.10 and 1954.50.
Comment: MACD is above 50 level and Pairs above its 20MA & 55MA.
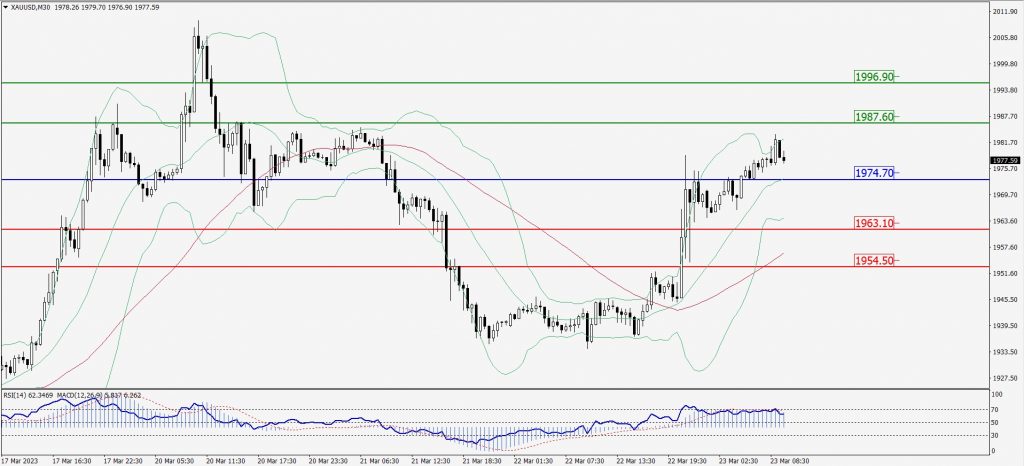
Green Lines Indicate Resistance Levels – Red Lines Indicate Support Levels
Light Blue is a Pivot Point – Black represents the price when the report was produced
Dow Jones Intraday: Resistance level at 32,279.00
Our pivot point is 32,279.00
Preferable Price Action: Take sell positions below the pivot with targets at 32,093.00 & 31,962.00.
Alternative Price Action: Above 32,279.00 looks for further upside to 32,457.00 & 32,590.00.
Comment: RSI is below 50 levels and Pairs below 55MA.
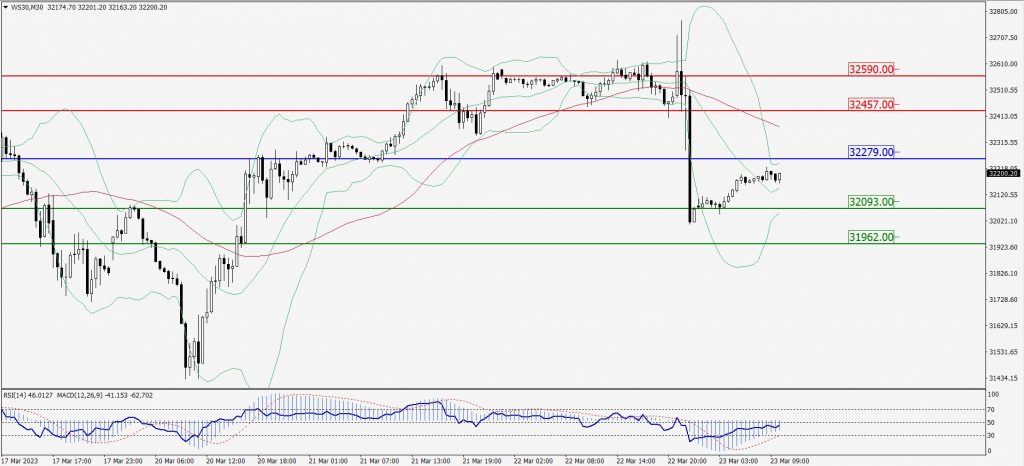
Green Lines Indicate Resistance Levels – Red Lines Indicate Support Levels
Light Blue is a Pivot Point – Black represents the price when the report was produced