Market Wrap: Stocks, Bonds, Commodities
US stocks rallied on Thursday, as Treasury yields pulled back from earlier highs following comments from Atlanta Federal Reserve President Raphael Bostic about his favored path of interest rate hikes for the central bank.
The Dow Jones Industrial Average rose 341.73 points to 33,003.57, the S&P 500 gain 0.76% to 3,981.35 and the Nasdaq Composite add 83.50 points to 11,462.98
MSCI’s index of Asia-Pacific stocks outside Japan is advance 0.78% to 640.94 levels. The Australian index was higher by 0.39% to 7,283.60. Japanese Nikkei Index rose 1.56% today.
European stocks were positive on Friday, with the Stoxx Europe 50 Index gain 0.59% to 4,240.59, Germany’s DAX rose 0.15% to 15,327.64, and France’s CAC advance 0.69% to 7,284.22, and U.K.’s FTSE 100 add 0.37% to 7,944.04.
Benchmark 10-year U.S. Treasury fell as demand for safe assets ascend again, today 10-year bond yields are negative 0.81% to 4.0400.
Oil prices rose on Thursday, boosted by signs of a strong economic rebound in top crude importer China and easing worries of aggressive US rate hikes.
Spot Brent crude oil fell 0.45% to $84.37 per barrel. US West Texas Intermediate crude is down 0.45% to $77.81 a barrel.
The yellow metal gold is advance 0.42% to 1,848.25 dollars per ounce.
Market Wrap: Forex
European stock markets are expected to open higher Friday, boosted by gains in Asia and on Wall Street overnight ahead of the release of euro zone services activity data.
Today, the U.S. dollar index measures the Greenback against a trade-weighted basket of six major currencies, which slipped 0.19% to 104.793.
The Euro US Dollar (EUR/USD) is a widely traded pair that is up 0.14% today. This left the pair trading around $1.06110.
The Japanese yen was negative against the U.S. dollar on Friday. Today USD/JPY is decline 0.22% to the 136.450 level.
Another commodity-related currency positive against the U.S dollar, AUD/USD gain 0.32% to 0.67510, and NZD/USD rose 0.11% to 0.62240 level.
EUR/USD Intraday: Trend on the upside
Our pivot point is at 1.06140
Preferable Price Action: Take long positions above pivot level with targets at 1.06390 & 1.06570 in extension.
Alternative Price Action: Below pivot looks for a further downside to 1.05900 & 1.05720.
Comment: RSI is above 50 levels and Pairs above its 20MA & 55MA.
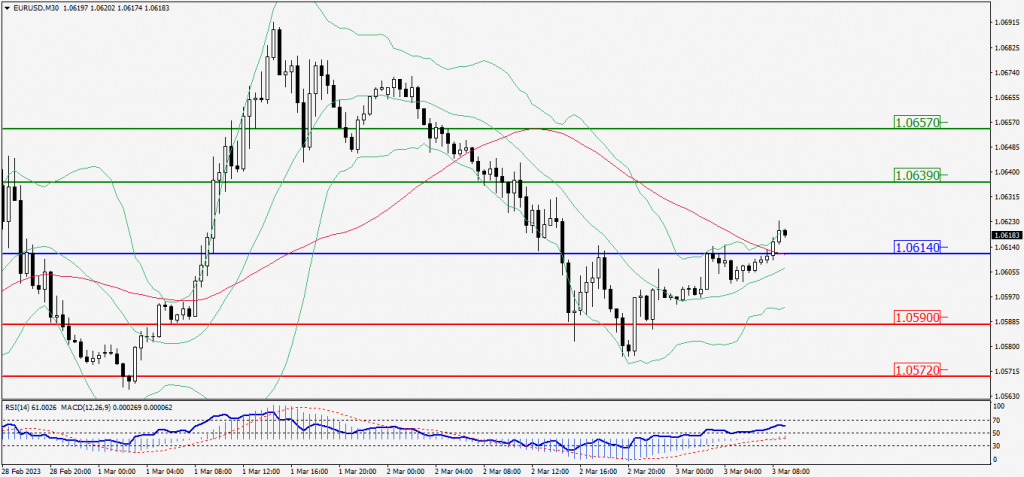
Green Lines Indicate Resistance Levels – Red Lines Indicate Support Levels
Light Blue is a Pivot Point – Black represents the price when the report was produced
GBP/USD Intraday: Support level at 1.19690
Our pivot point is at 1.19690
Preferable Price Action: Buy positions above pivot with targets at 1.20260 & 1.20680 in extension.
Alternative Price Action: The price below pivot would call for further downside to 1.19130 & 1.18700.
Comment: RSI is above 50 levels and Pairs above its 20MA & 55MA.
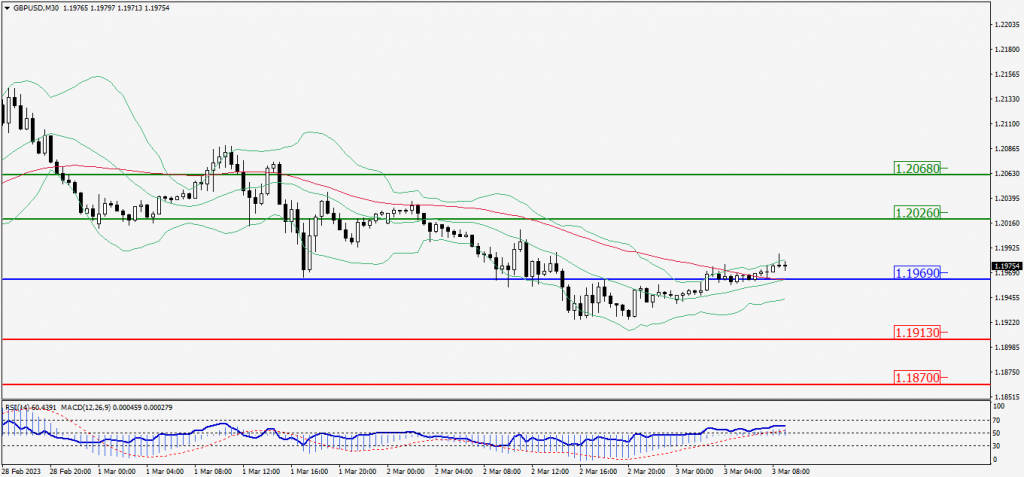
Green Lines Indicate Resistance Levels – Red Lines Indicate Support Levels
Light Blue is a Pivot Point – Black represents the price when the report was produced
USD/JPY Intraday: Trend on the downside
Our pivot point is at 136.590
Preferable Price Action: Sell position below pivot with the target at 136.180 and 135.900 in extension.
Alternative Price Action: The upside breakout of the pivot would call for 137.010 and 137.280.
Comment: MACD is below 50 level and Pairs below its 20MA & 55MA.
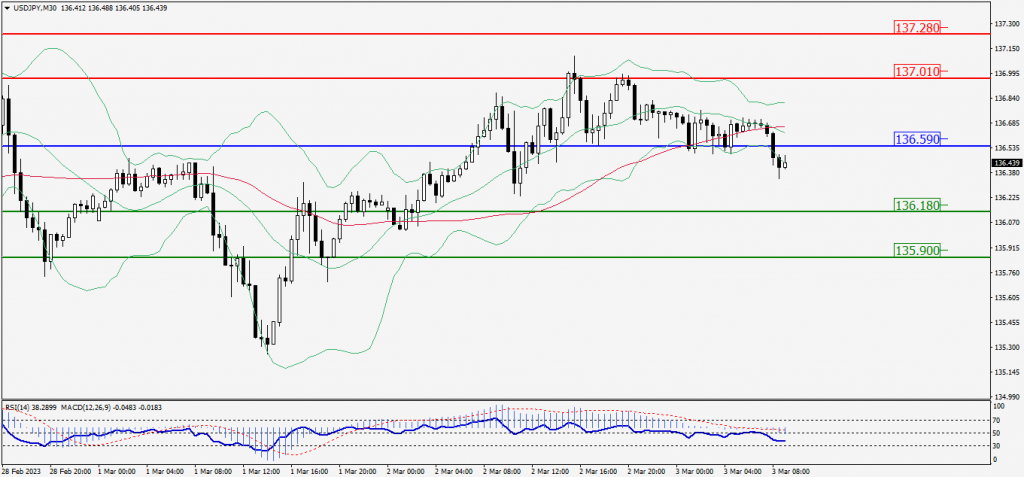
Green Lines Indicate Resistance Levels – Red Lines Indicate Support Levels
Light Blue is a Pivot Point – Black represents the price when the report was produced
AUD/USD Intraday: Major trend on the upside
Our pivot point is at 0.67510
Preferable Price Action: Buy positions above pivot with targets at 0.67690 & 0.67810 in extension.
Alternative Price Action: Below pivot looks for a further downside with 0.67340 & 0.67230 as targets.
Comment: RSI is above 50 levels and pairs above its 20MA & 55MA.
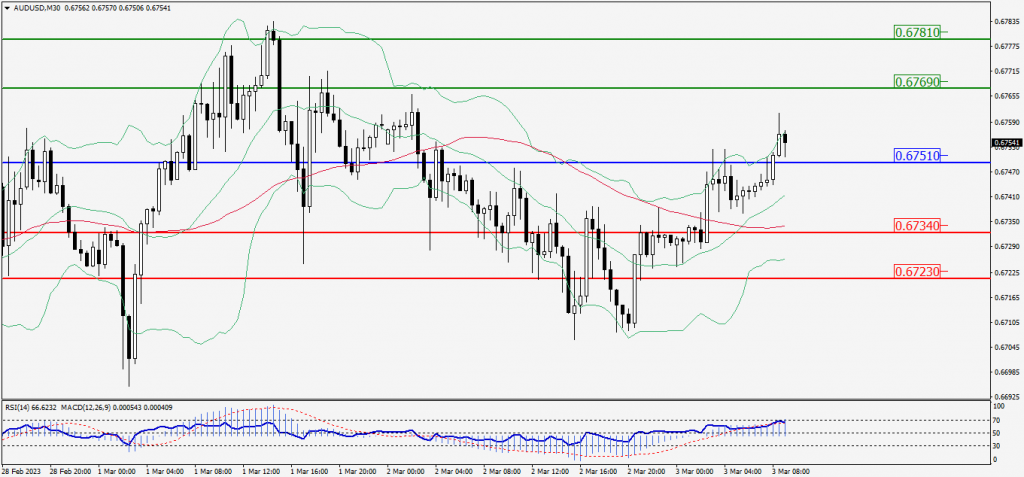
Green Lines Indicate Resistance Levels – Red Lines Indicate Support Levels
Light Blue is a Pivot Point – Black represents the price when the report was produced
CRUDEOIL Intraday: In a consolidation zone
Our pivot point is at 77.99
Preferable Price Action: Above pivot buy oil with 78.72 & 79.24 as targets.
Alternative Price Action: Sell crude below pivot with targets at 77.28 and 76.76 in extension.
Comment: MACD is flat territory and Pairs above its 20MA & 55MA.
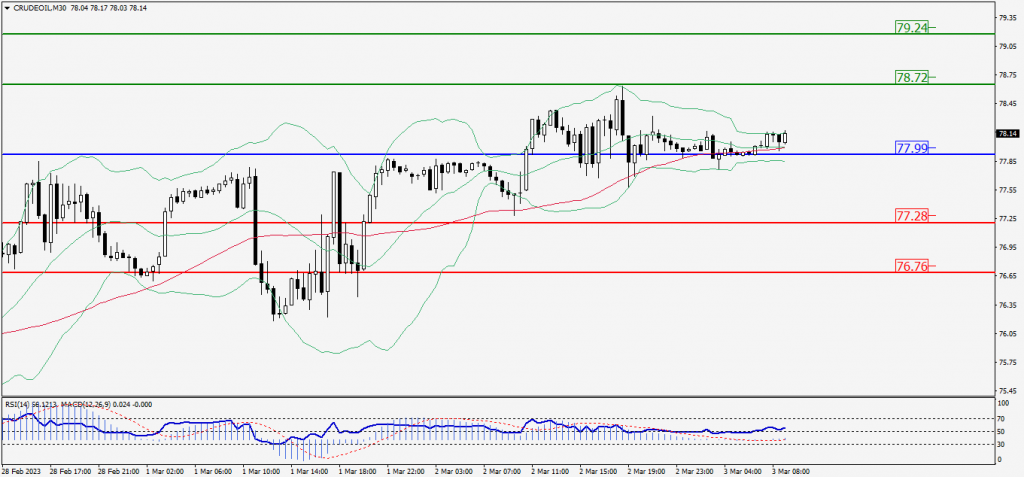
Green Lines Indicate Resistance Levels – Red Lines Indicate Support Levels
Light Blue is a Pivot Point – Black represents the price when the report was produced
XAU/USD Intraday: Trend on the upside
Our pivot point is 1840.20
Preferable Price Action: Further upside to 1852.60 and 1861.10
Alternative Price Action: If the price gives a downside breakout of a pivot, then the price extends to 1828.30 and 1819.20.
Comment: MACD is above 50 level and Pairs above its 20MA & 55MA.
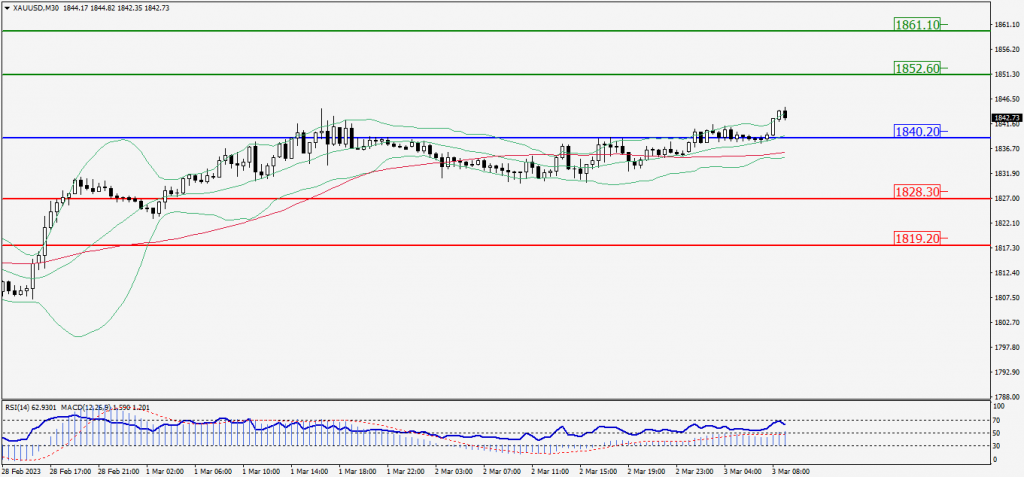
Green Lines Indicate Resistance Levels – Red Lines Indicate Support Levels
Light Blue is a Pivot Point – Black represents the price when the report was produced
Dow Jones Intraday: In a consolidation zone
Our pivot point is 33,004.00
Preferable Price Action: Take sell positions below the pivot with targets at 32,846.00 & 32,726.00.
Alternative Price Action: Above 33,004.00 looks for further upside to 33,158.00 & 33,276.00.
Comment: RSI is at 50 levels and Pairs below 20MA.
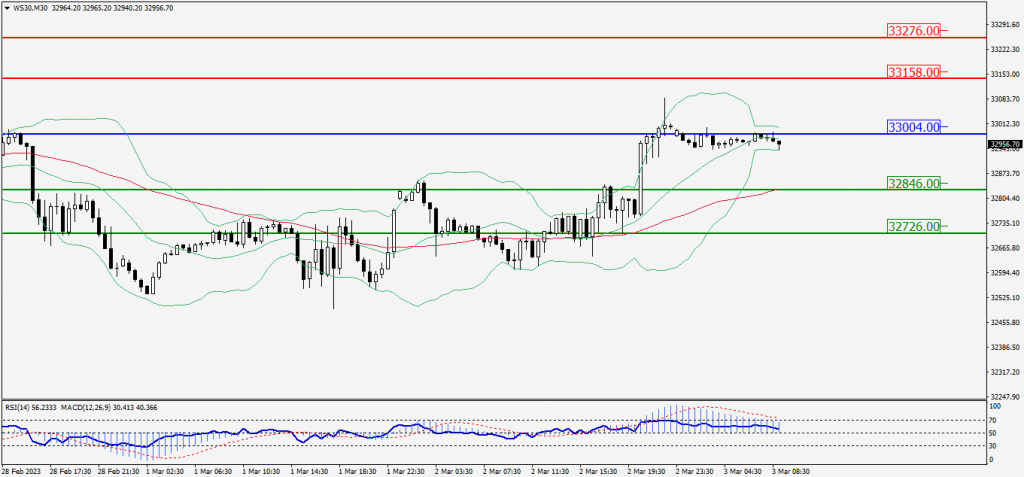
Green Lines Indicate Resistance Levels – Red Lines Indicate Support Levels
Light Blue is a Pivot Point – Black represents the price when the report was produced