Market Wrap: Stocks, Bonds, Commodities
US stock indexes closed lower on Thursday after data pointing to a tight labor market renewed concerns the Federal Reserve will continue its aggressive path of rate hikes that could lead the economy into a recession.
The Dow Jones Industrial Average fell 252.40 points to 33,044.56, the S&P 500 lose 0.76% to 3,898.85 and the Nasdaq Composite add 104.74 points to 10,852.27.
MSCI’s index of Asia-Pacific stocks outside Japan is ascend 0.77% to 672.88 levels. The Australian index was higher by 0.23% to 7,452.20. Japanese Nikkei Index gain 0.56% today.
European stocks were negative on Friday, with the Stoxx Europe 50 Index fell 1.92% to 4,094.28, Germany’s DAX lose 1.72% to 14,920.36, and France’s CAC decline 1.86% to 6,951.87, and U.K.’s FTSE 100 subtract 1.07% to 7,747.29.
Benchmark 10-year U.S. Treasury fell as demand for safe assets ascend again, today 10-year bond yields are positive 0.30% to 3.409.
Oil prices settled 1% higher on Thursday, extending a recent rally built around rising Chinese demand, while the market wrote off a second straight week of large builds in US crude inventories.
Spot Brent crude oil rose 0.58% to $86.66 per barrel. US West Texas Intermediate crude is up 0.63% to $81.12 a barrel.
The yellow metal gold is advance 0.43% to 1,932.15 dollars per ounce.
Market Wrap: Forex
European stock markets are expected to open higher Friday, with investors attempting to maintain January’s positive tone amid concerns about slowing economic growth and tight monetary policy.
Today, the U.S. dollar index measures the Greenback against a trade-weighted basket of six major currencies, which surge 0.03% to 101.858.
The Euro US Dollar (EUR/USD) is a widely traded pair that is up 0.13% today. This left the pair trading around $1.0841.
The Japanese yen was positive against the U.S. dollar on Friday. Today USD/JPY is ascend 0.34% to the 128.86 level.
Another commodity-related currency positive against the U.S dollar, AUD/USD rose 0.36% to 0.6934, and NZD/USD gain 0.46% to 0.6421 level.
EUR/USD Intraday: In a consolidation zone
Our pivot point is at 1.08340
Preferable Price Action: Take short positions below pivot level with targets at 1.08160 & 1.08040 in extension.
Alternative Price Action: Above pivot looks for a further upside to 1.08530 & 1.08660.
Comment: RSI is below 50 levels and Pairs below 20MA.
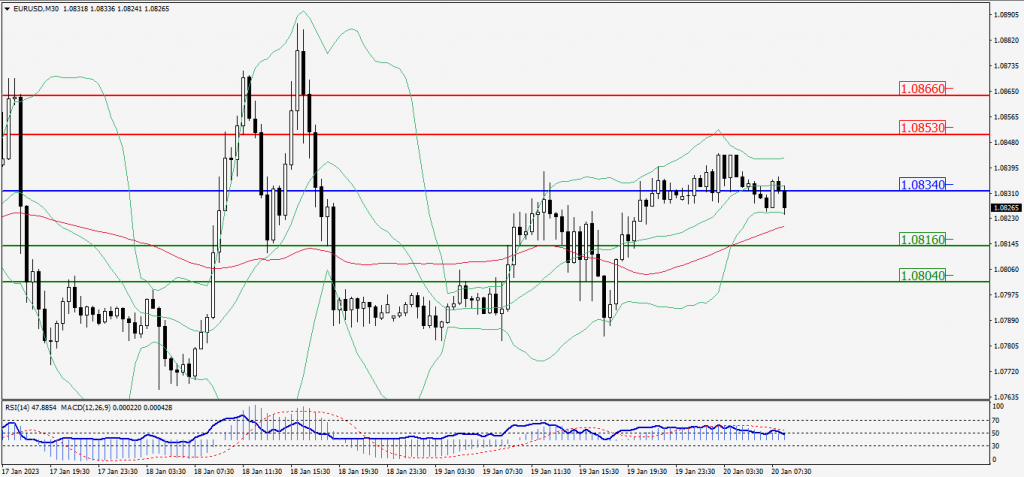
Green Lines Indicate Resistance Levels – Red Lines Indicate Support Levels
Light Blue is a Pivot Point – Black represents the price when the report was produced
GBP/USD Intraday: Trend on the downside
Our pivot point is at 1.23690
Preferable Price Action: Sell positions below pivot with targets at 1.23370 & 1.23180 in extension.
Alternative Price Action: The price above pivot would call for further upside to 1.24000 & 1.24190.
Comment: RSI is below 50 levels and Pairs below 20MA.
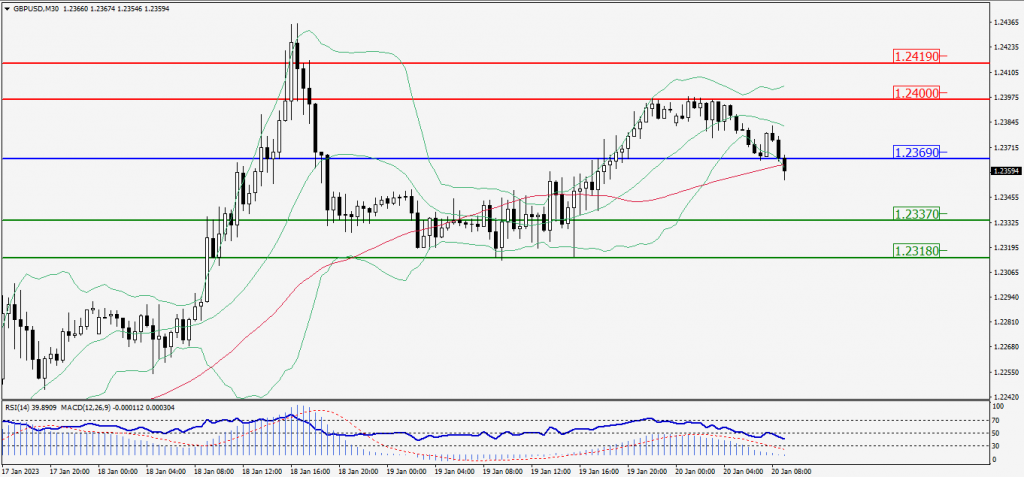
Green Lines Indicate Resistance Levels – Red Lines Indicate Support Levels
Light Blue is a Pivot Point – Black represents the price when the report was produced
USD/JPY Intraday: Major trend on the upside
Our pivot point is at 129.010
Preferable Price Action: Buy position above pivot with the target at 129.720 and 130.120 in extension.
Alternative Price Action: The downside breakout of the pivot would call for 128.360 and 127.960.
Comment: MACD is above 50 level and Pairs above its 20MA & 55MA.
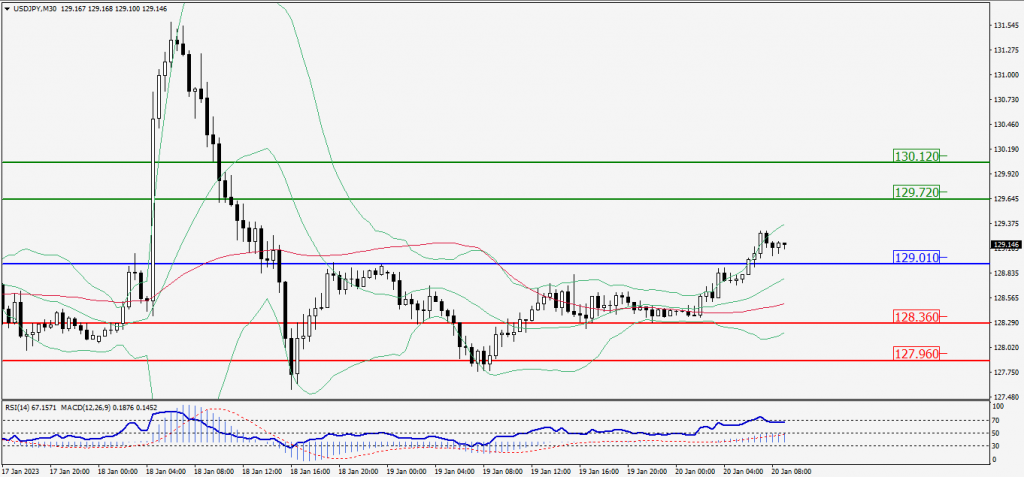
Green Lines Indicate Resistance Levels – Red Lines Indicate Support Levels
Light Blue is a Pivot Point – Black represents the price when the report was produced
AUD/USD Intraday: Trend on the upside
Our pivot point is at 0.69220
Preferable Price Action: Buy positions above pivot with targets at 0.69530 & 0.69750 in extension.
Alternative Price Action: Below pivot looks for a further downside with 0.68910 & 0.68720 as targets.
Comment: RSI is above 50 levels and pairs above its 20MA & 55MA.
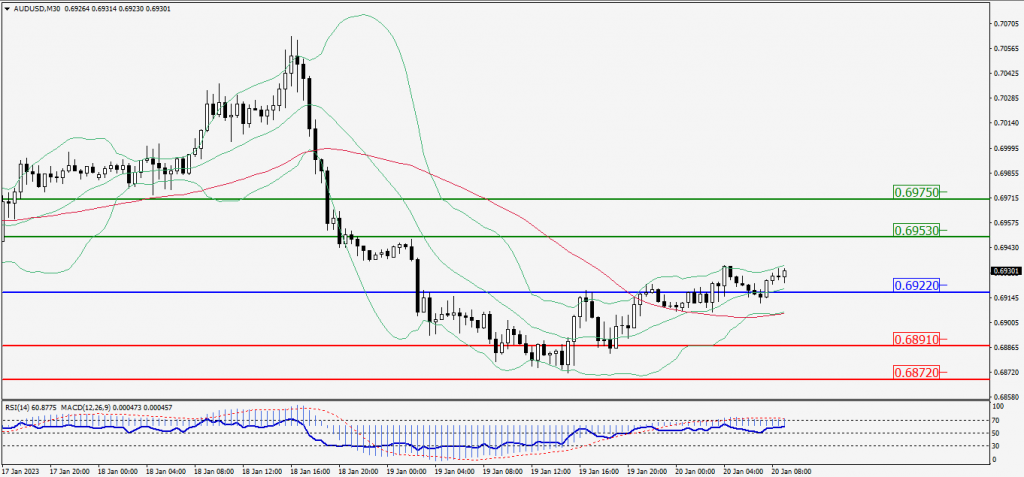
Green Lines Indicate Resistance Levels – Red Lines Indicate Support Levels
Light Blue is a Pivot Point – Black represents the price when the report was produced
CRUDEOIL Intraday: Support level at 80.91
Our pivot point is at 80.91
Preferable Price Action: Above pivot buy oil with 81.55 & 81.95 as targets.
Alternative Price Action: Sell crude down pivot with targets at 80.28 and 79.87 in extension.
Comment: MACD is positive territory and Pairs above 55MA.
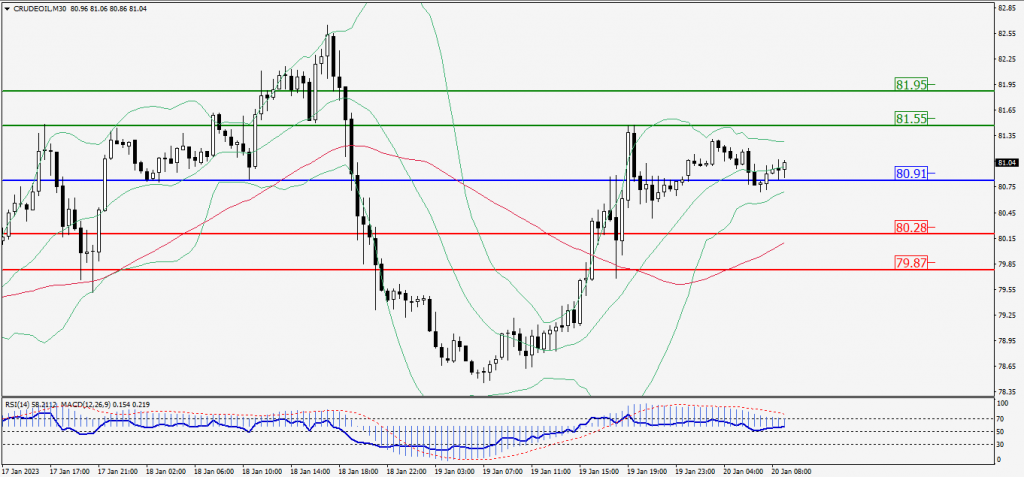
Green Lines Indicate Resistance Levels – Red Lines Indicate Support Levels
Light Blue is a Pivot Point – Black represents the price when the report was produced
XAU/USD Intraday: Trend on the upside
Our pivot point is 1927.10
Preferable Price Action: Further upside to 1933.20 and 1936.90
Alternative Price Action: If the price gives an downside breakout of a pivot, then the price extends to 1921.40 and 1917.50.
Comment: MACD is above 50 level and Pairs above 55MA.
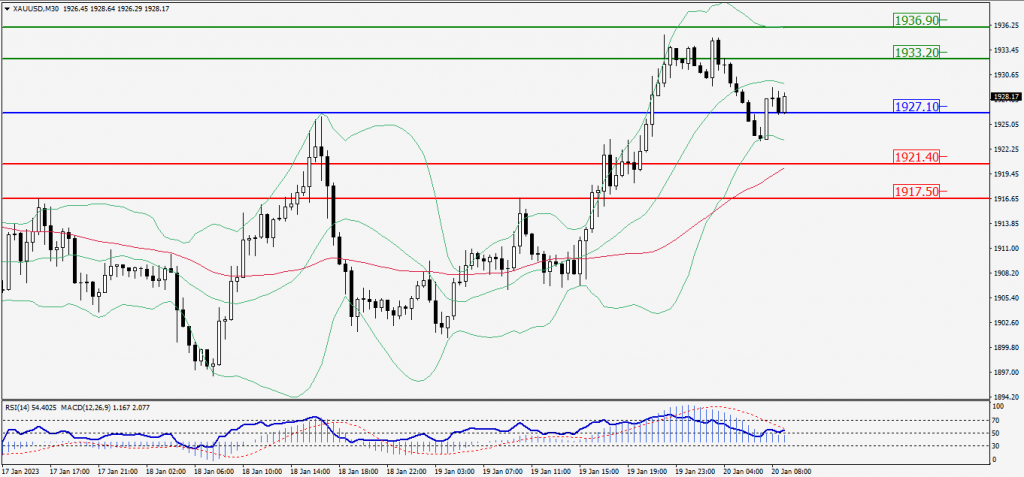
Green Lines Indicate Resistance Levels – Red Lines Indicate Support Levels
Light Blue is a Pivot Point – Black represents the price when the report was produced
Dow Jones Intraday: Trend on the upside
Our pivot point is 33,094.00
Preferable Price Action: Take buy positions up the pivot with targets at 33,338.00 & 33,534.00.
Alternative Price Action: Below 33,094.00 looks for further downside to 32,840.00 & 32,658.00.
Comment: RSI is above 50 levels and Pairs above 20MA.
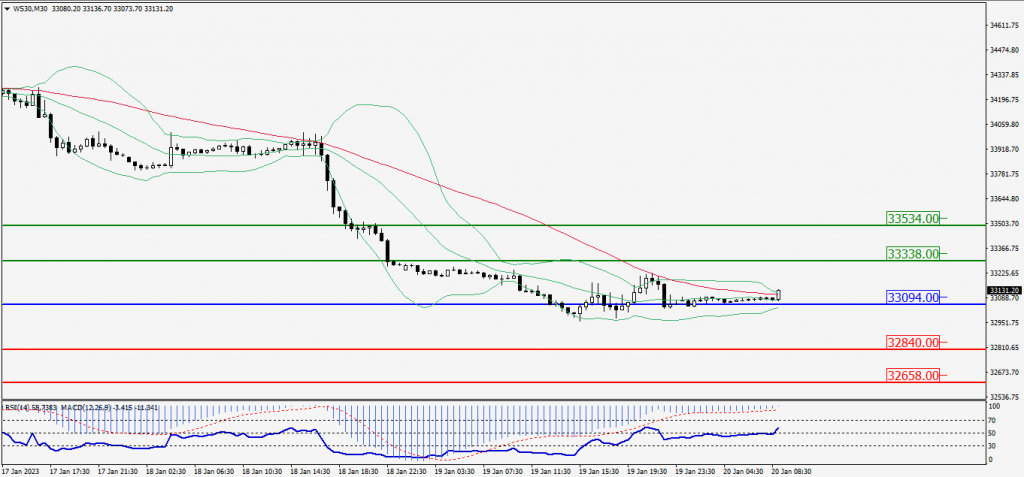
Green Lines Indicate Resistance Levels – Red Lines Indicate Support Levels
Light Blue is a Pivot Point – Black represents the price when the report was produced