Market Wrap: Stocks, Bonds, Commodities
The Dow fell more than 1 percent on Tuesday as weak earnings from Goldman Sachs dragged the index lower, but a jump in Tesla shares helped the Nasdaq stay positive as the corporate earnings season took center stage.
The Dow Jones Industrial Average fell 391.76 points to 33,910.85, the S&P 500 lose 0.20% to 3,990.97 and the Nasdaq Composite add 15.96 points to 11,095.11.
MSCI’s index of Asia-Pacific stocks outside Japan is ascend 0.21% to 667.64 levels. The Australian index was higher by 0.10% to 7,393.40. Japanese Nikkei Index gain 2.50% today.
European stocks were mixed on Wednesday, with the Stoxx Europe 50 Index rose 0.06% to 4,176.75, Germany’s DAX lose 0.04% to 15,180.45, and France’s CAC decline 0.01% to 7,076.60, and U.K.’s FTSE 100 add 0.04% to 7,853.78.
Benchmark 10-year U.S. Treasury fell as demand for safe assets ascend again, today 10-year bond yields are negative 1.52% to 3.481.
Oil prices settled higher on Tuesday in choppy trading after China posted weak but expectation-beating annual economic growth data and on hopes that a recent shift in its Covid-19 policy will boost fuel demand.
Spot Brent crude oil rose 0.97% to $86.75 per barrel. US West Texas Intermediate crude is up 1.16% to $81.38 a barrel.
The yellow metal gold is advance 0.10% to 1,911.85 dollars per ounce.
Market Wrap: Forex
European stock markets are expected to open in a mixed fashion Wednesday, as investors digest fresh inflation data out of the U.K. as well as dovish signals from the Bank of Japan.
Today, the U.S. dollar index measures the Greenback against a trade-weighted basket of six major currencies, which slipped 0.13% to 102.007.
The Euro US Dollar (EUR/USD) is a widely traded pair that is up 0.43% today. This left the pair trading around $1.0834.
The Japanese yen was positive against the U.S. dollar on Wednesday. Today USD/JPY is ascend 1.60% to the 130.19 level.
Another commodity-related currency positive against the U.S dollar, AUD/USD rose 0.53% to 0.7024, and NZD/USD gain 0.78% to 0.6477 level.
EUR/USD Intraday: Trend on the downside
Our pivot point is at 1.07960
Preferable Price Action: Take short positions below pivot level with targets at 1.07670 & 1.07520 in extension.
Alternative Price Action: Above pivot looks for a further upside to 1.08260 & 1.08410.
Comment: RSI is below 50 levels and Pairs below 55MA.
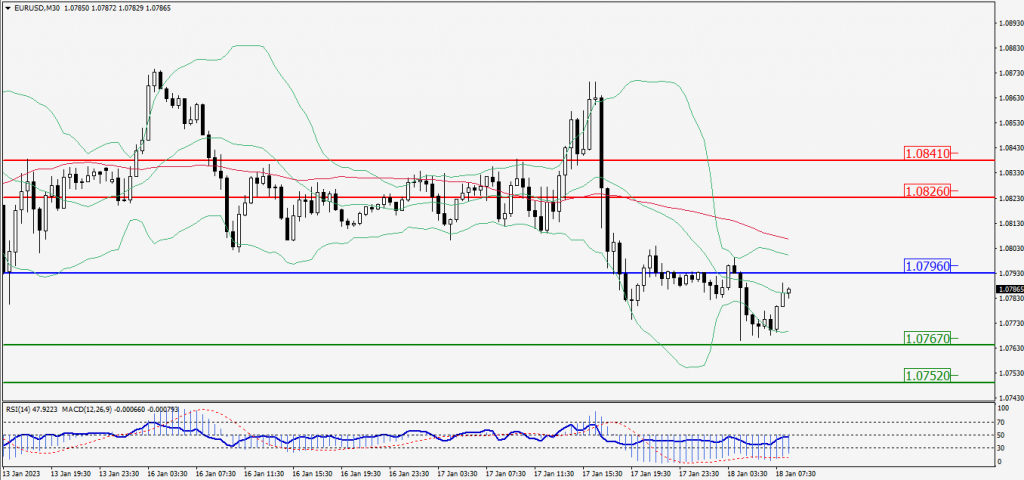
Green Lines Indicate Resistance Levels – Red Lines Indicate Support Levels
Light Blue is a Pivot Point – Black represents the price when the report was produced
GBP/USD Intraday: Support level at 1.22790
Our pivot point is at 1.22790
Preferable Price Action: Buy positions above pivot with targets at 1.23120 & 1.23310 in extension.
Alternative Price Action: The price below pivot would call for further downside to 1.22490 & 1.22280.
Comment: RSI is above 50 levels and Pairs above 55MA.
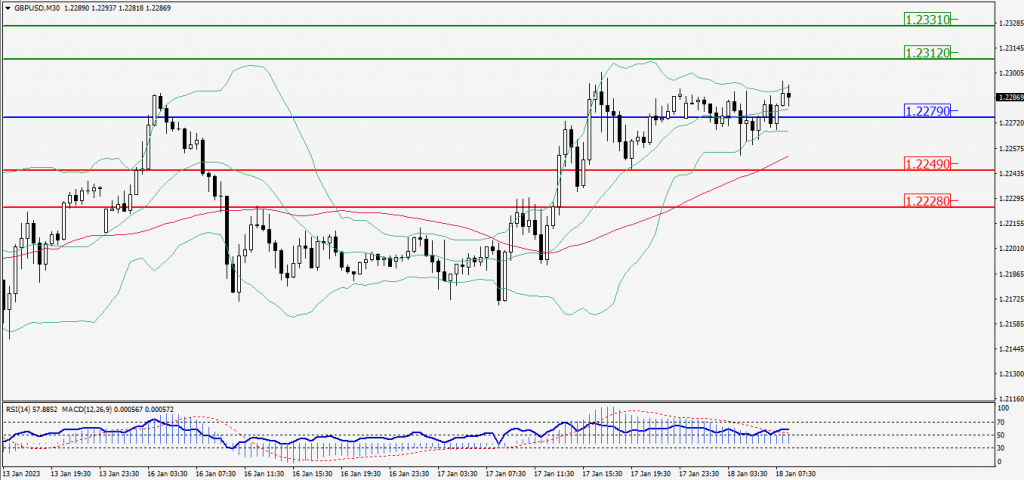
Green Lines Indicate Resistance Levels – Red Lines Indicate Support Levels
Light Blue is a Pivot Point – Black represents the price when the report was produced
USD/JPY Intraday: Major trend on the upside
Our pivot point is at 130.980
Preferable Price Action: Buy position above pivot with the target at 132.040 and 132.670 in extension.
Alternative Price Action: The downside breakout of the pivot would call for 130.040 and 129.430.
Comment: MACD is above 50 level and Pairs above its 20MA & 55MA.
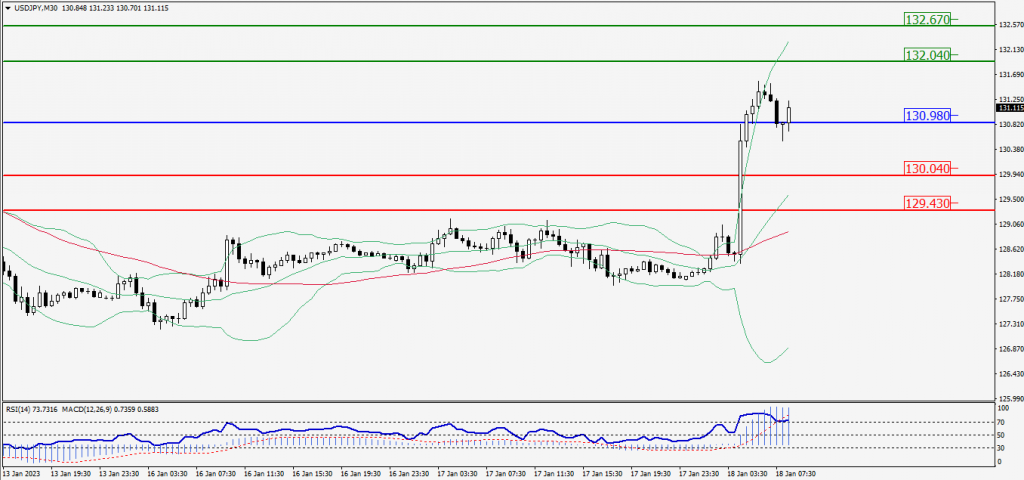
Green Lines Indicate Resistance Levels – Red Lines Indicate Support Levels
Light Blue is a Pivot Point – Black represents the price when the report was produced
AUD/USD Intraday: Trend on the upside
Our pivot point is at 0.69960
Preferable Price Action: Buy positions above pivot with targets at 0.70140 & 0.70250 in extension.
Alternative Price Action: Below pivot looks for a further downside with 0.69780 & 0.69680 as targets.
Comment: RSI is above 50 levels and pairs above its 20MA & 55MA.
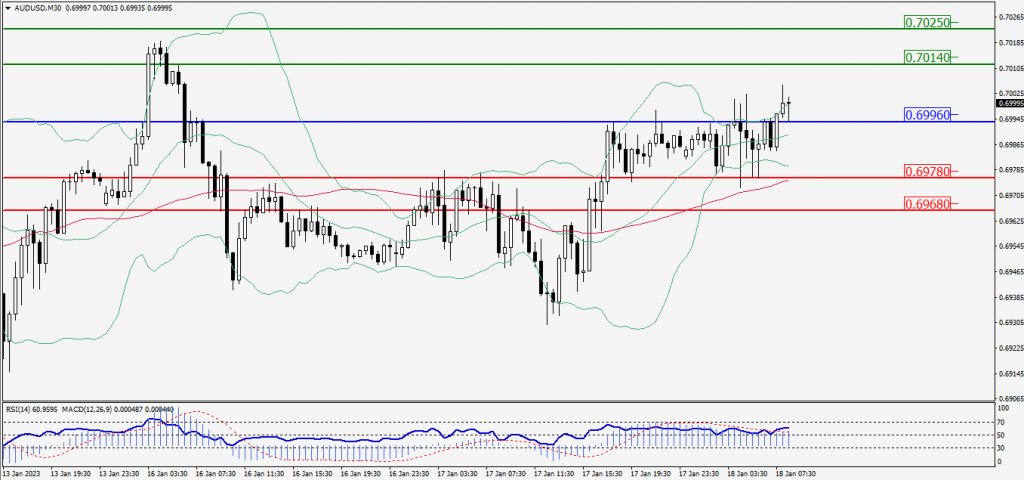
Green Lines Indicate Resistance Levels – Red Lines Indicate Support Levels
Light Blue is a Pivot Point – Black represents the price when the report was produced
CRUDEOIL Intraday: Trend on the upside
Our pivot point is at 81.11
Preferable Price Action: Above pivot buy oil with 82.17 & 82.74 as targets.
Alternative Price Action: Sell crude down pivot with targets at 80.09 and 79.52 in extension.
Comment: MACD is positive territory and Pairs above its 20MA & 55MA.
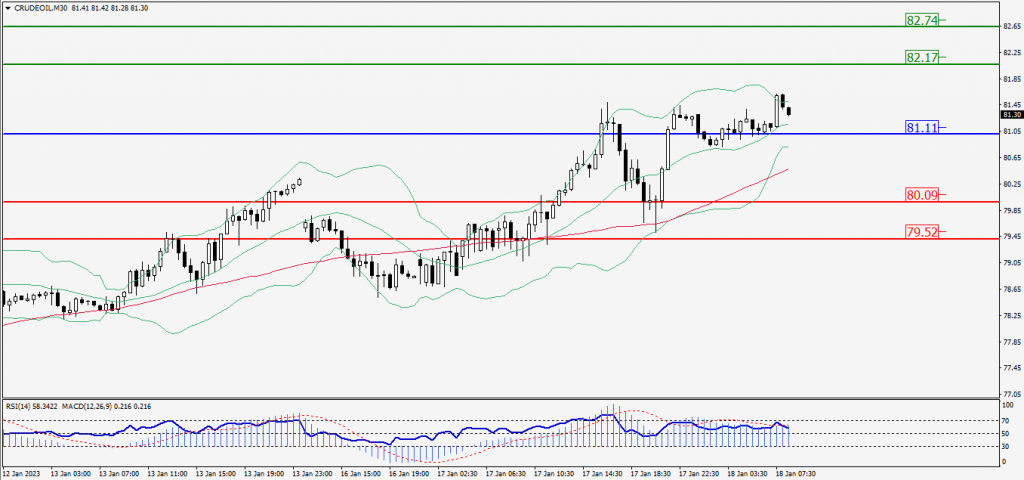
Green Lines Indicate Resistance Levels – Red Lines Indicate Support Levels
Light Blue is a Pivot Point – Black represents the price when the report was produced
XAU/USD Intraday: In a consolidation zone
Our pivot point is 1906.40
Preferable Price Action: Further downside to 1900.50 and 1896.90
Alternative Price Action: If the price gives an upside breakout of a pivot, then the price extends to 1912.30 and 1915.80.
Comment: MACD is at 50 level and Pairs below its 55MA.
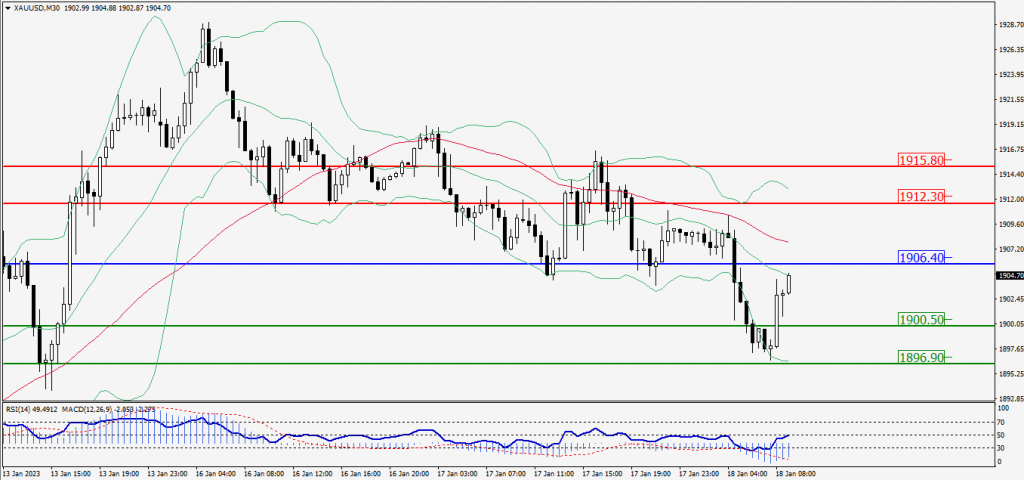
Green Lines Indicate Resistance Levels – Red Lines Indicate Support Levels
Light Blue is a Pivot Point – Black represents the price when the report was produced
Dow Jones Intraday: In a consolidation zone
Our pivot point is 33,908.00
Preferable Price Action: Take buy positions up the pivot with targets at 34,054.00 & 34,130.00.
Alternative Price Action: Below 33,908.00 looks for further downside to 33,770.00 & 33,696.00.
Comment: RSI is above 50 levels and Pairs above 20MA.
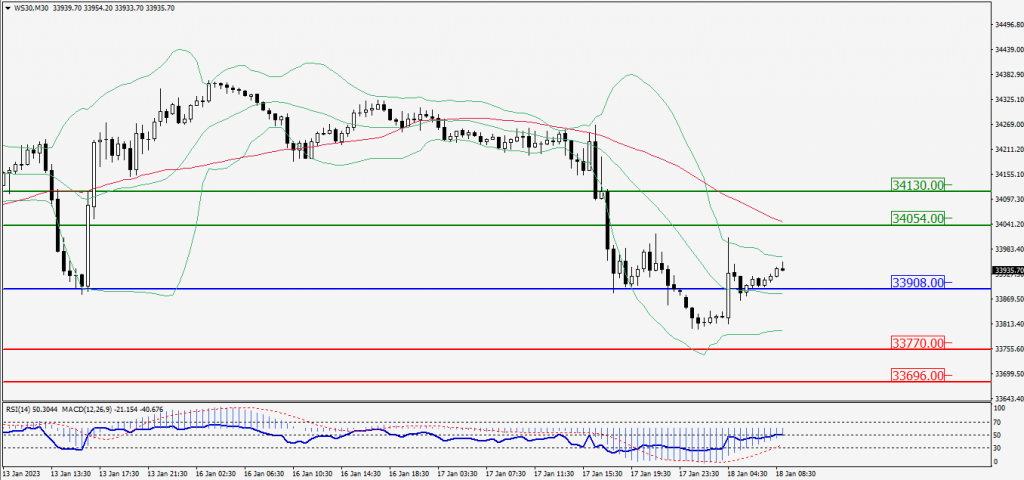
Green Lines Indicate Resistance Levels – Red Lines Indicate Support Levels
Light Blue is a Pivot Point – Black represents the price when the report was produced