Market Wrap: Stocks, Bonds, Commodities
Stock futures were down slightly Monday night as investors attempted to keep building on early 2023 momentum and looked ahead to more corporate earnings.
The Dow Jones Industrial Average rose 112.64 points to 34,302.61, the S&P 500 gain 0.40% to 3,999.09 and the Nasdaq Composite add 78.05 points to 11,079.16.
MSCI’s index of Asia-Pacific stocks outside Japan is drop 0.64% to 665.21 levels. The Australian index was lower by 0.03% to 7,386.30. Japanese Nikkei Index gain 1.23% today.
European stocks were positive on Tuesday, with the Stoxx Europe 50 Index rose 0.15% to 4,157.00, Germany’s DAX gain 0.31% to 15,134.04, and France’s CAC advance 0.28% to 7,043.31, and U.K.’s FTSE 100 add 0.20% to 7,860.07.
Benchmark 10-year U.S. Treasury fell as demand for safe assets ascend again, today 10-year bond yields are positive 1.25% to 3.555.
Oil prices fell in early trade on Tuesday as recession fears dominated headlines out of the World Economic Forum’s meeting in Davos, draining optimism that stoked the market last week on prospects of a fuel demand recovery in top oil importer China.
Spot Brent crude oil fell 0.01% to $84.45 per barrel. US West Texas Intermediate crude is down 0.91% to $79.38 a barrel.
The yellow metal gold is decline 0.53% to 1,911.45 dollars per ounce.
Market Wrap: Forex
European stock markets are expected to open slightly lower Tuesday, as investors digest dire Chinese growth numbers with concerns about the global economic outlook high on the agenda.
Today, the U.S. dollar index measures the Greenback against a trade-weighted basket of six major currencies, which surge 0.21% to 102.155.
The Euro US Dollar (EUR/USD) is a widely traded pair that is up 0.06% today. This left the pair trading around $1.0823.
The Japanese yen was positive against the U.S. dollar on Tuesday. Today USD/JPY is ascend 0.25% to the 128.86 level.
Another commodity-related currency positive against the U.S dollar, AUD/USD rose 0.01% to 0.6955, and NZD/USD gain 0.22% to 0.639 level.
EUR/USD Intraday: Trend on the upside
Our pivot point is at 1.08260
Preferable Price Action: Take long positions above pivot level with targets at 1.08490 & 1.08650 in extension.
Alternative Price Action: Below pivot looks for a further downside to 1.08040 & 1.07880.
Comment: RSI is above 50 levels and Pairs above its 20MA & 55MA.
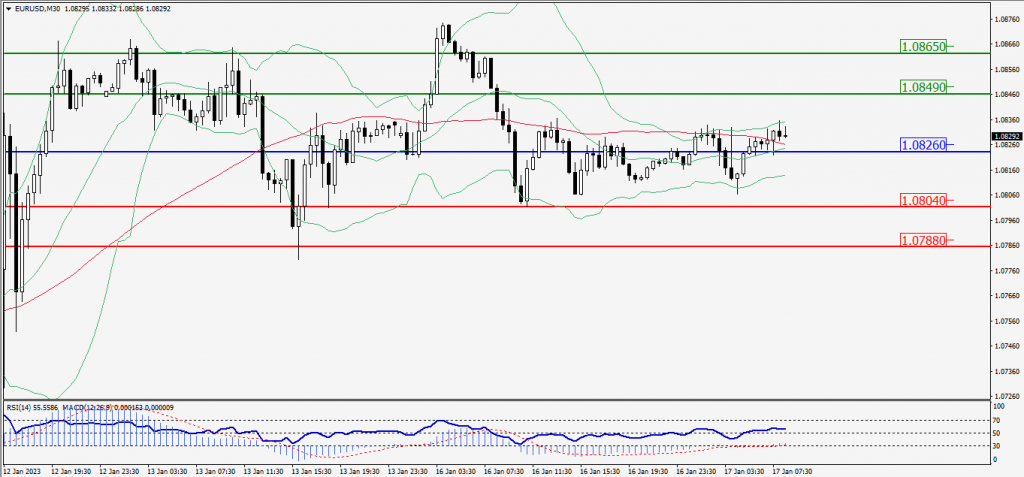
Green Lines Indicate Resistance Levels – Red Lines Indicate Support Levels
Light Blue is a Pivot Point – Black represents the price when the report was produced
GBP/USD Intraday: Resistance level at 1.21990
Our pivot point is at 1.21990
Preferable Price Action: Sell positions below pivot with targets at 1.21610 & 1.21380 in extension.
Alternative Price Action: The price above pivot would call for further upside to 1.22340 & 1.22570.
Comment: RSI is below 50 levels and Pairs below 55MA.
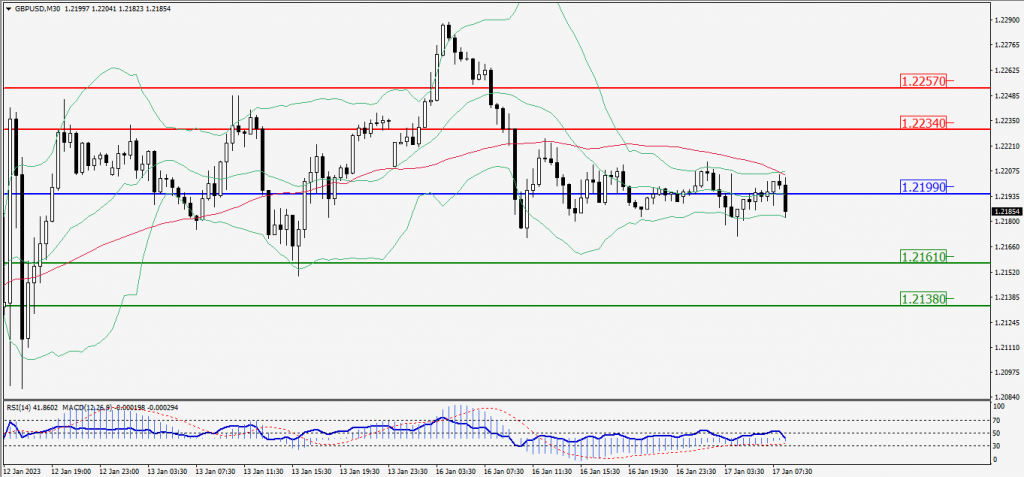
Green Lines Indicate Resistance Levels – Red Lines Indicate Support Levels
Light Blue is a Pivot Point – Black represents the price when the report was produced
USD/JPY Intraday: In a consolidation zone
Our pivot point is at 128.590
Preferable Price Action: Buy position above pivot with the target at 129.290 and 129.700 in extension.
Alternative Price Action: The downside breakout of the pivot would call for 127.930 and 127.520.
Comment: MACD is at 50 level and Pairs above 55MA.
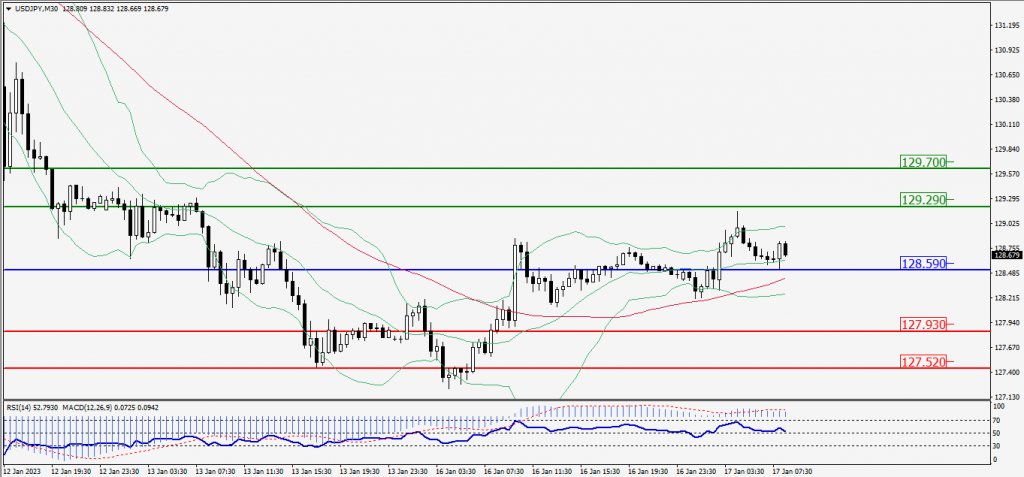
Green Lines Indicate Resistance Levels – Red Lines Indicate Support Levels
Light Blue is a Pivot Point – Black represents the price when the report was produced
AUD/USD Intraday: Trend on the downside
Our pivot point is at 0.69680
Preferable Price Action: Sell positions below pivot with targets at 0.69460 & 0.69310 in extension.
Alternative Price Action: Above pivot looks for a further upside with 0.69900 & 0.70050 as targets.
Comment: RSI is below 50 levels and pairs below 55MA.
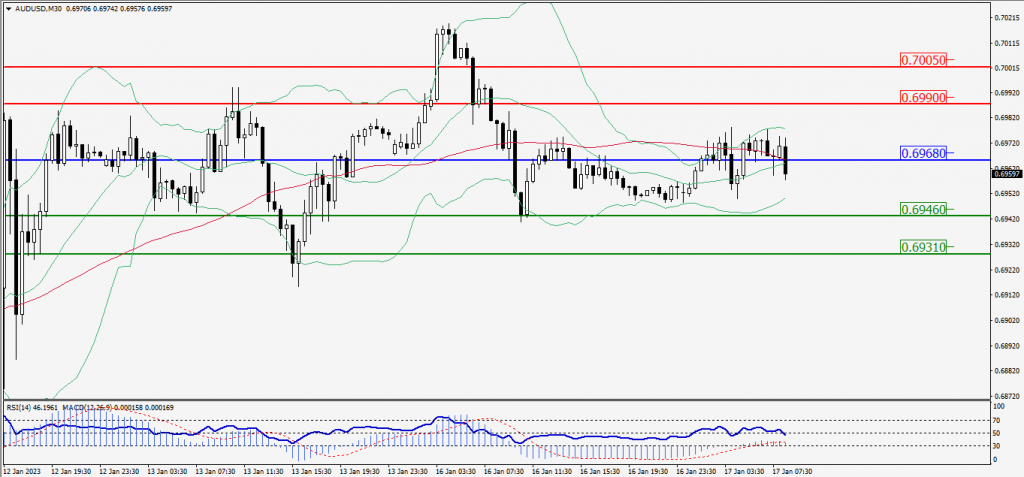
Green Lines Indicate Resistance Levels – Red Lines Indicate Support Levels
Light Blue is a Pivot Point – Black represents the price when the report was produced
CRUDEOIL Intraday: Trend on the upside
Our pivot point is at 79.35
Preferable Price Action: Above pivot buy oil with 79.87 & 80.20 as targets.
Alternative Price Action: Sell crude down pivot with targets at 78.87 and 78.56 in extension.
Comment: MACD is positive territory and Pairs above 20MA.
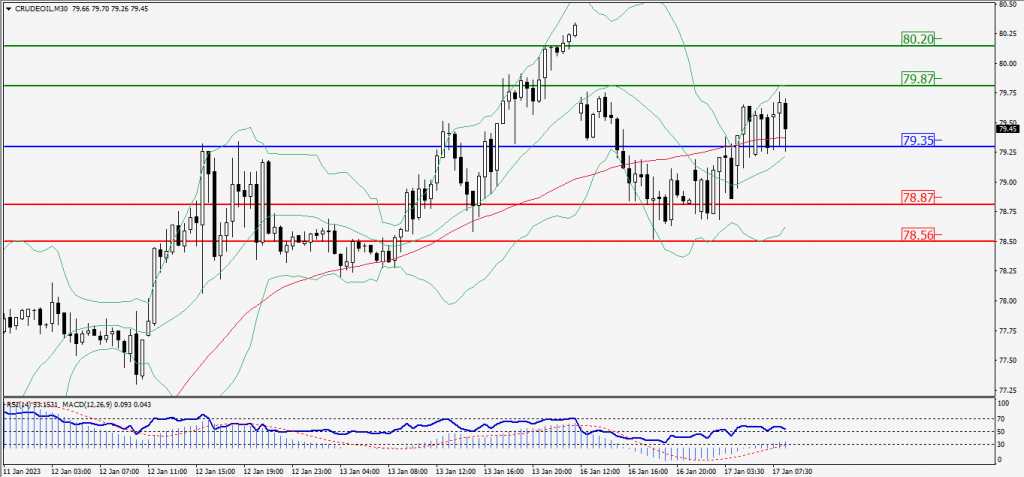
Green Lines Indicate Resistance Levels – Red Lines Indicate Support Levels
Light Blue is a Pivot Point – Black represents the price when the report was produced
XAU/USD Intraday: Major trend on the downside
Our pivot point is 1911.50
Preferable Price Action: Further downside to 1902.40 and 1896.70
Alternative Price Action: If the price gives an upside breakout of a pivot, then the price extends to 1920.50 and 1926.40.
Comment: MACD is below 50 level and Pairs below its 20MA & 55MA.
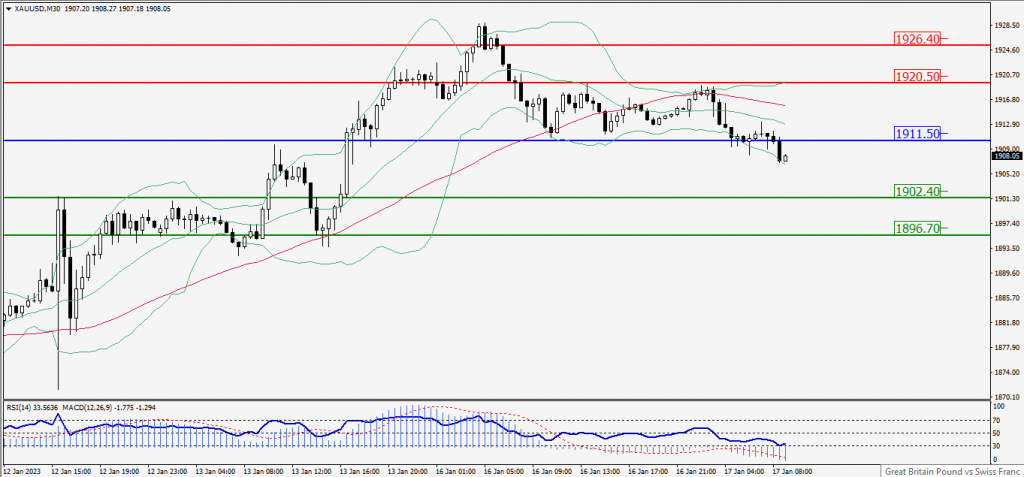
Green Lines Indicate Resistance Levels – Red Lines Indicate Support Levels
Light Blue is a Pivot Point – Black represents the price when the report was produced
Dow Jones Intraday: Resistance level at 34273.00
Our pivot point is 34,273.00
Preferable Price Action: Take sell positions down the pivot with targets at 34,159.00 & 34,078.00.
Alternative Price Action: Above 34,273.00 looks for further upside to 34,390.00 & 34,466.00.
Comment: RSI is below 50 levels and Pairs below its 20MA & 55MA.
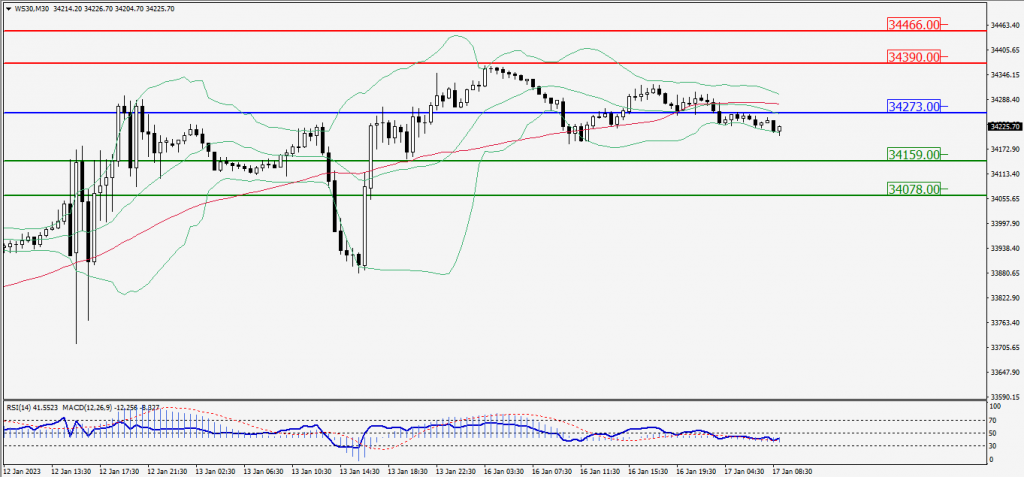
Green Lines Indicate Resistance Levels – Red Lines Indicate Support Levels
Light Blue is a Pivot Point – Black represents the price when the report was produced