Market Wrap: Stocks, Bonds, Commodities
The S&P 500 and Nasdaq finished at their highest levels in a month on Friday, with shares of JPMorgan Chase and other banks rising following their quarterly results, which kicked off the earnings season.
The Dow Jones Industrial Average rose 112.64 points to 34,302.61, the S&P 500 gain 0.40% to 3,999.09 and the Nasdaq Composite add 78.05 points to 11,079.16.
MSCI’s index of Asia-Pacific stocks outside Japan is ascend 0.26% to 669.32 levels. The Australian index was higher by 0.82% to 7,388.20. Japanese Nikkei Index lose 1.14% today.
European stocks were positive on Monday, with the Stoxx Europe 50 Index rose 0.58% to 4,150.80, Germany’s DAX gain 0.19% to 15,086.52, and France’s CAC advance 0.69% to 7,023.50, and U.K.’s FTSE 100 add 0.64% to 7,844.07.
Benchmark 10-year U.S. Treasury fell as demand for safe assets ascend again, today 10-year bond yields are positive 0.37% to 3.498.
Oil prices fell on Monday after a sharp rally last week, as traders turned cautious and locked in some profits ahead of demand forecasts from the OPEC and the IEA, as well as a barrage of economic data due this week.
Spot Brent crude oil fell 0.82% to $84.58 per barrel. US West Texas Intermediate crude is down 1.04% to $79.28 a barrel.
The yellow metal gold is decline 0.08% to 1,920.15 dollars per ounce.
Market Wrap: Forex
European stock markets are expected to trade in a mixed fashion at the open Monday, at the start of a week that includes important inflation data, a policy-setting meeting by the Bank of Japan as well as the return of the World Economic Forum to Davos.
Today, the U.S. dollar index measures the Greenback against a trade-weighted basket of six major currencies, which slipped 0.01% to 101.933.
The Euro US Dollar (EUR/USD) is a widely traded pair that is up 0.04% today. This left the pair trading around $1.0832.
The Japanese yen was negative against the U.S. dollar on Monday. Today USD/JPY is drop 0.11% to the 128.01 level.
Another commodity-related currency positive against the U.S dollar, AUD/USD rose 0.04% to 0.6978, and NZD/USD gain 0.13% to 0.6393 level.
EUR/USD Intraday: Trend on the downside
Our pivot point is at 1.08500
Preferable Price Action: Take short positions below pivot level with targets at 1.08140 & 1.07900 in extension.
Alternative Price Action: Above pivot looks for a further upside to 1.08860 & 1.09110.
Comment: RSI is below 50 levels and Pairs below 20MA.
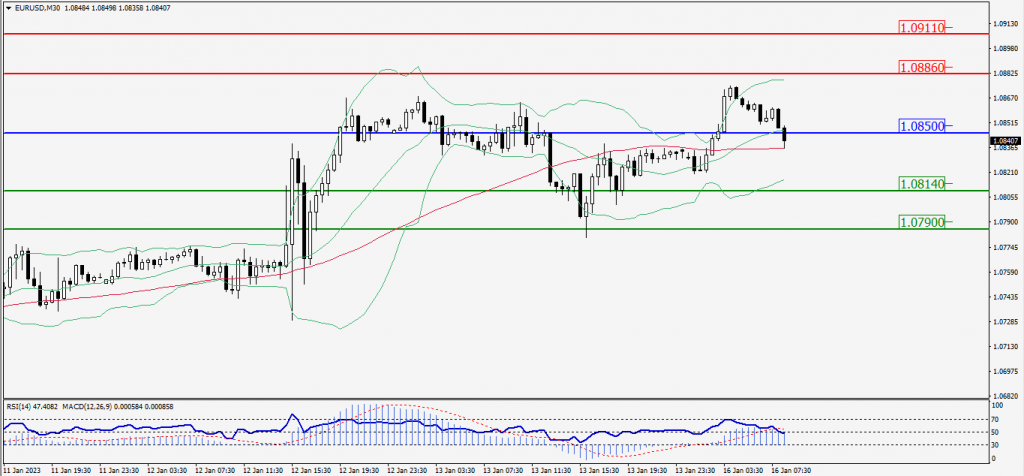
Green Lines Indicate Resistance Levels – Red Lines Indicate Support Levels
Light Blue is a Pivot Point – Black represents the price when the report was produced
GBP/USD Intraday: In a consolidation zone
Our pivot point is at 1.22570
Preferable Price Action: Sell positions below pivot with targets at 1.22190 & 1.21940 in extension.
Alternative Price Action: The price above pivot would call for further upside to 1.22950 & 1.23180.
Comment: RSI is at 50 levels and Pairs below 20MA.
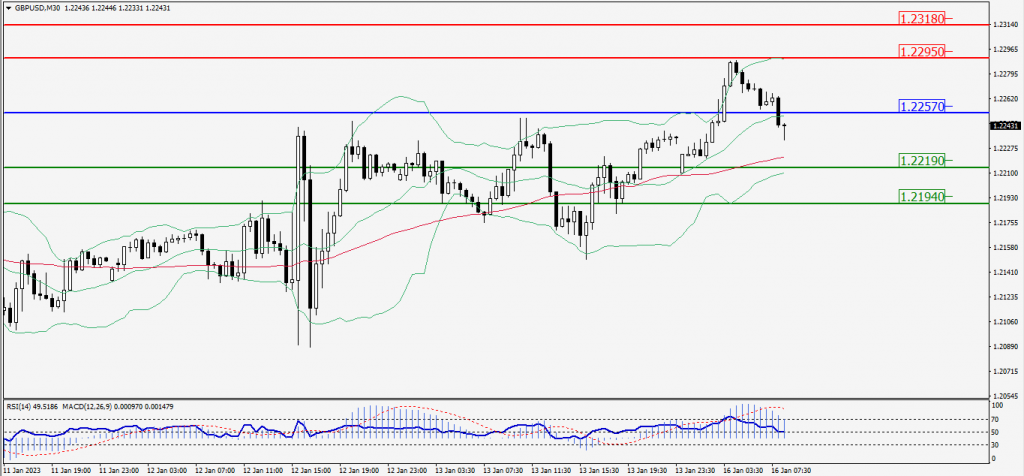
Green Lines Indicate Resistance Levels – Red Lines Indicate Support Levels
Light Blue is a Pivot Point – Black represents the price when the report was produced
USD/JPY Intraday: Support level at 127.810
Our pivot point is at 127.810
Preferable Price Action: Buy position above pivot with the target at 129.180 and 130.260 in extension.
Alternative Price Action: The downside breakout of the pivot would call for 126.540 and 125.490.
Comment: MACD is positive territory and Pairs above 20MA.
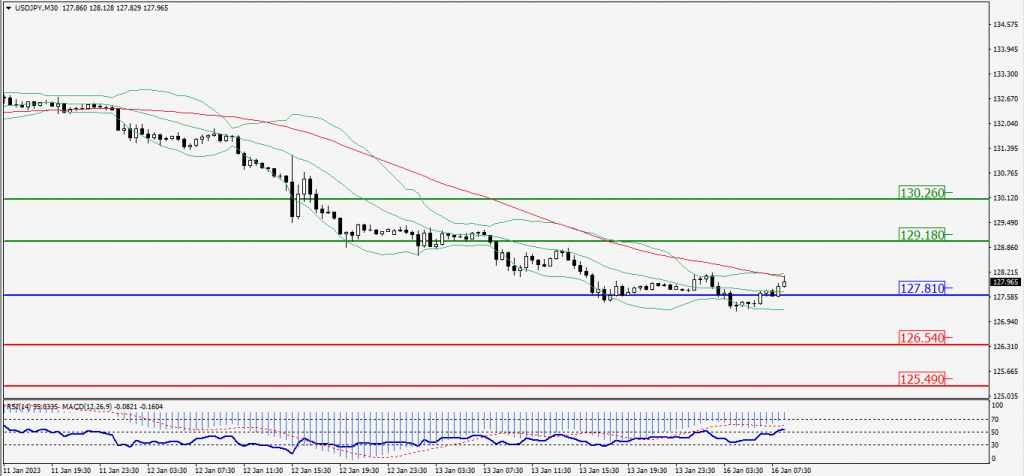
Green Lines Indicate Resistance Levels – Red Lines Indicate Support Levels
Light Blue is a Pivot Point – Black represents the price when the report was produced
AUD/USD Intraday: Trend on the downside
Our pivot point is at 0.69880
Preferable Price Action: Sell positions below pivot with targets at 0.69580 & 0.69400 in extension.
Alternative Price Action: Above pivot looks for a further upside with 0.70180 & 0.70370 as targets.
Comment: RSI is below 50 levels and pairs below 20MA.
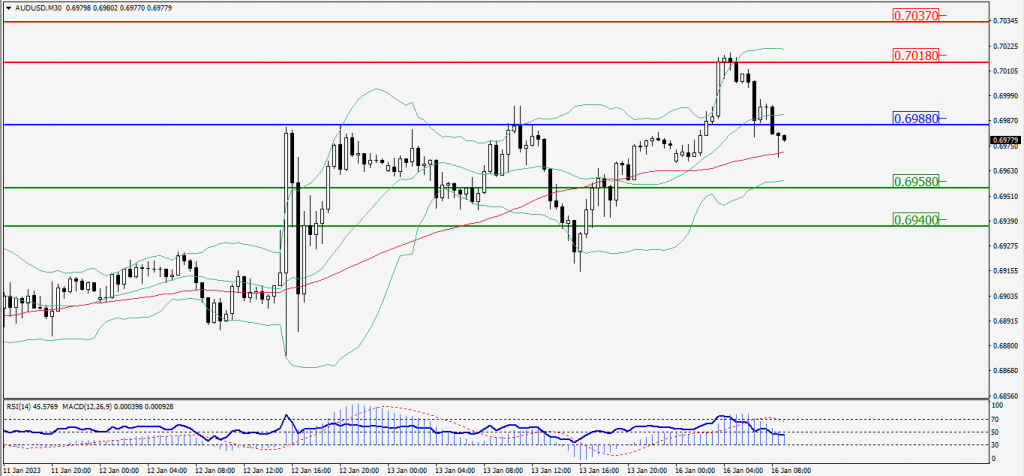
Green Lines Indicate Resistance Levels – Red Lines Indicate Support Levels
Light Blue is a Pivot Point – Black represents the price when the report was produced
XAU/USD Intraday: Resistance level at 1920.20
Our pivot point is 1920.20
Preferable Price Action: Further downside to 1905.60 and 1895.20
Alternative Price Action: If the price gives a upside breakout of a pivot, then the price extends to 1935.10 and 1945.10.
Comment: MACD is below 50 level and Pairs below 20MA.
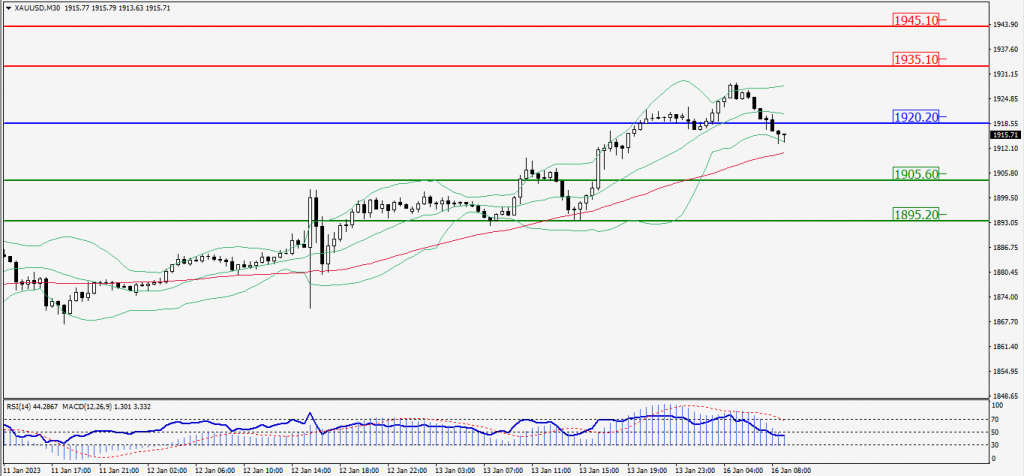
Green Lines Indicate Resistance Levels – Red Lines Indicate Support Levels
Light Blue is a Pivot Point – Black represents the price when the report was produced
Dow Jones Intraday: Trend on the downside
Our pivot point is 34,330.00
Preferable Price Action: Take sell positions down the pivot with targets at 34,165.00 & 34,054.00.
Alternative Price Action: Above 34,330.00 looks for further upside to 34,489.00 & 34,603.00.
Comment: RSI is below 50 levels and Pairs below 20MA.
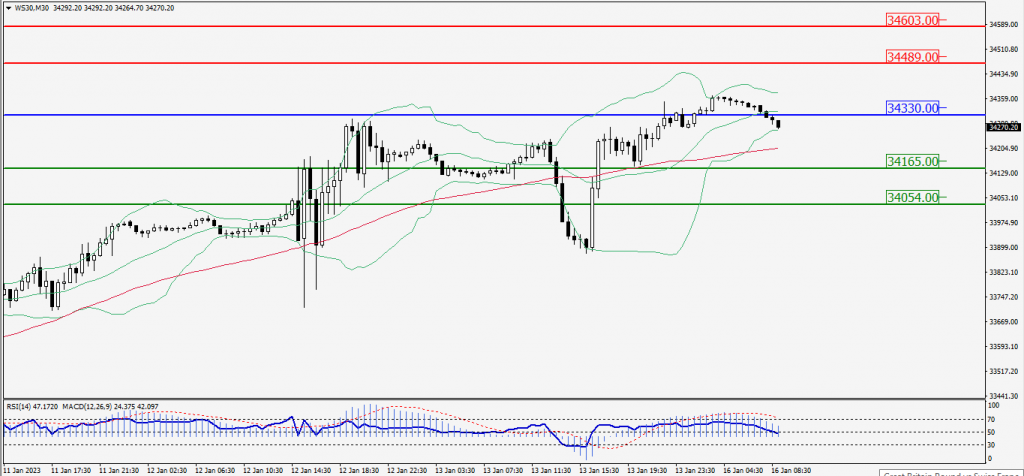
Green Lines Indicate Resistance Levels – Red Lines Indicate Support Levels
Light Blue is a Pivot Point – Black represents the price when the report was produced