Market Wrap: Stocks, Bonds, Commodities
Wall Street’s main indices lost more than 1 percent on Thursday, with Nasdaq leading the declines, as evidence of a tight labor market eroded hopes that the Federal Reserve could pause its rating hiking cycle anytime soon as it keeps focused on inflation.
The Dow Jones Industrial Average fell 339.69 points to 33,930.08, the S&P 500 lose 1.16% to 3,808.10 and the Nasdaq Composite subtract 153.52 points to 10,305.24.
MSCI’s index of Asia-Pacific stocks outside Japan is decline 0.03% to 641.31 levels. The Australian index was higher by 0.65% to 7,109.60. Japanese Nikkei Index gain 0.59% today.
European stocks were mixed on Friday, with the Stoxx Europe 50 Index fell 0.36% to 3,959.48, Germany’s DAX lose 0.38% to 14,436.31, and France’s CAC decline 0.22% to 6,761.50, and U.K.’s FTSE 100 add 0.64% to 7,633.45.
Benchmark 10-year U.S. Treasury fell as demand for safe assets ascend again, today 10-year bond yields are negative 0.46% to 3.705.
Oil prices rose around 1% on Friday, extending gains from the previous trading session after data showed lower fuel inventories following a winter storm that hit the United States at the year end.
Spot Brent crude oil rose 0.25% to $78.89 per barrel. US West Texas Intermediate crude is up 0.37% to $73.94 a barrel.
The yellow metal gold is advance 0.07% to 1,841.95 dollars per ounce.
Market Wrap: Forex
European stock markets traded in a subdued fashion Friday after mixed German economic data, as investors await key Eurozone inflation ahead of the release of the widely-watched U.S. monthly jobs report.
Today, the U.S. dollar index measures the Greenback against a trade-weighted basket of six major currencies, which surge 0.23% to 105.070.
The Euro US Dollar (EUR/USD) is a widely traded pair that is down 0.09% today. This left the pair trading around $1.0511.
The Japanese yen was negative against the U.S. dollar on Friday. Today USD/JPY is ascend 0.51% to the 134.07 level.
Another commodity-related currency mixed against the U.S dollar, AUD/USD rose 0.04% to 0.6751, and NZD/USD lose 0.19% to 0.6216 level.
EUR/USD Intraday: Trend on the downside
Our pivot point is at 1.05480
Preferable Price Action: Take short positions below pivot level with targets at 1.04760 & 1.04190 in extension.
Alternative Price Action: Above pivot looks for a further upside to 1.06190 & 1.06730.
Comment: RSI below 50 levels and Pairs below 55MA.
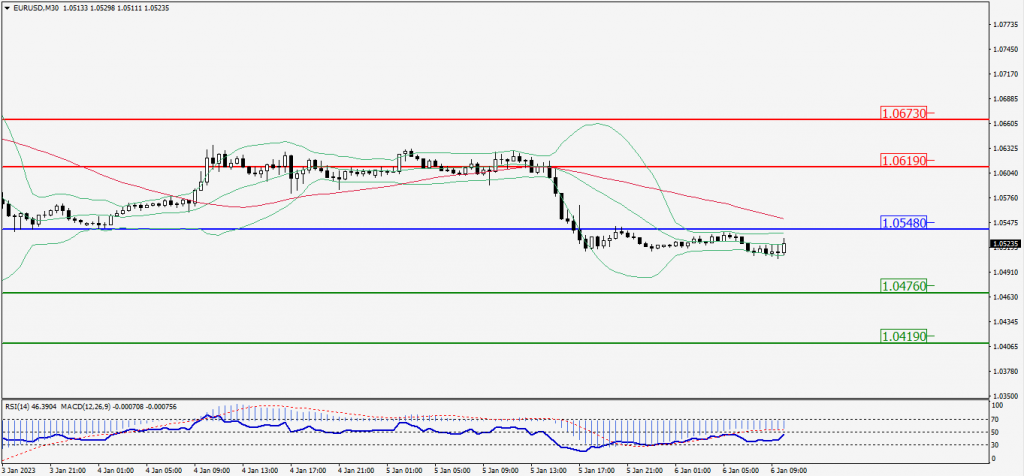
Green Lines Indicate Resistance Levels – Red Lines Indicate Support Levels
Light Blue is a Pivot Point – Black represents the price when the report was produced
GBP/USD Intraday: Major trend on the downside
Our pivot point is at 1.19200
Preferable Price Action: Sell positions below pivot with targets at 1.18710 & 1.18350 in extension.
Alternative Price Action: The price above pivot would call for further upside to 1.19680 & 1.20020.
Comment: RSI is below 50 levels and Pairs below 55MA.
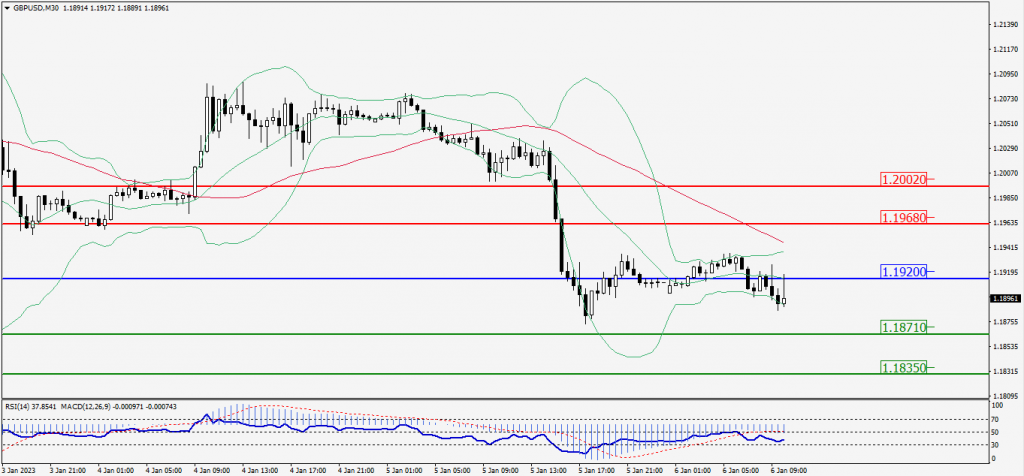
Green Lines Indicate Resistance Levels – Red Lines Indicate Support Levels
Light Blue is a Pivot Point – Black represents the price when the report was produced
USD/JPY Intraday: Major trend on the upside
Our pivot point is at 134.030
Preferable Price Action: Buy position above pivot with the target at 135.270 and 136.200 in extension.
Alternative Price Action: The downside breakout of the pivot would call for 132.800 and 131.870.
Comment: MACD is positive territory and Pairs above its 20MA & 55MA.
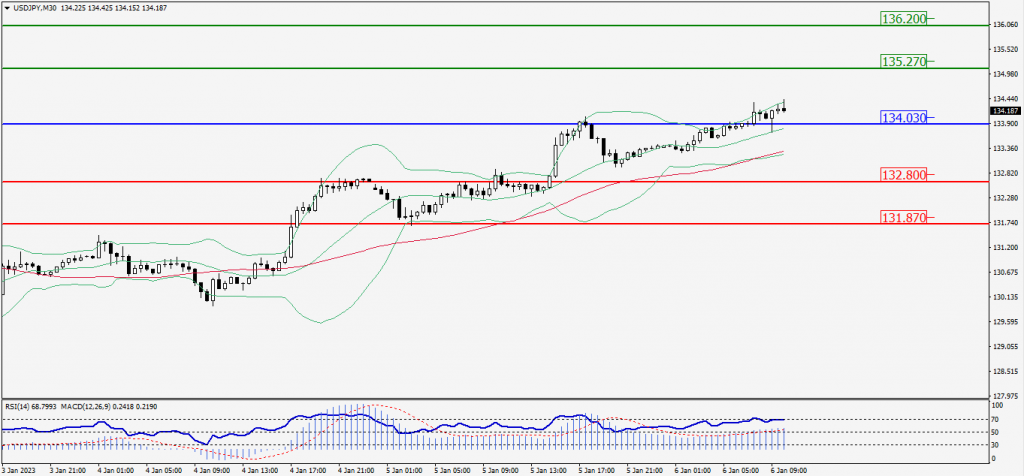
Green Lines Indicate Resistance Levels – Red Lines Indicate Support Levels
Light Blue is a Pivot Point – Black represents the price when the report was produced
AUD/USD Intraday: Resistance level at 0.67700
Our pivot point is at 0.67700
Preferable Price Action: Sell Positions below pivot with targets at 0.67230 & 0.66920 in extension.
Alternative Price Action: Above pivot looks for a further upside with 0.68130 & 0.68450 as targets.
Comment: RSI is below 50 levels and pairs below it’s 20MA & 55MA.
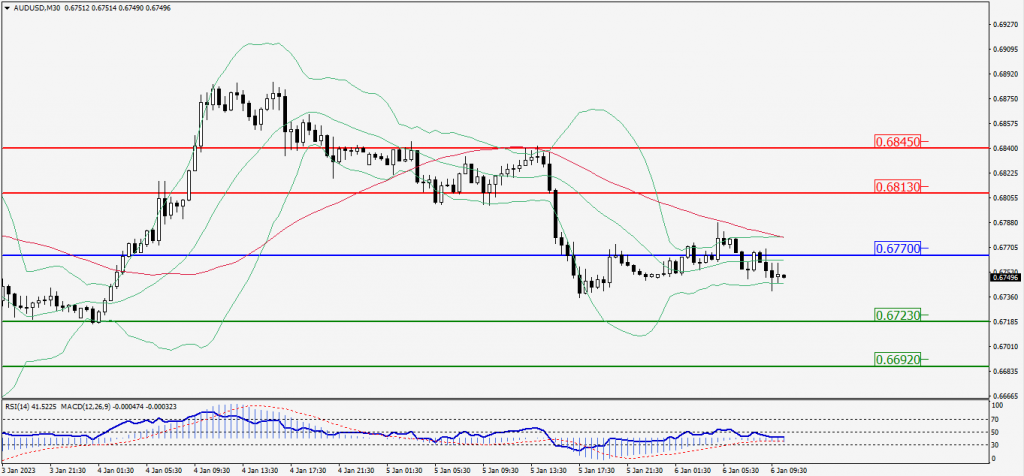
Green Lines Indicate Resistance Levels – Red Lines Indicate Support Levels
Light Blue is a Pivot Point – Black represents the price when the report was produced
CRUDEOIL Intraday: Trend on the downside
Our pivot point is at 74.60
Preferable Price Action: Below pivots sell oil with 72.31 & 70.44 as targets.
Alternative Price Action: Buy crude up pivot with targets at 76.90 and 78.73 in extension.
Comment: MACD is negative territory and Pairs below its 20MA & 55MA.
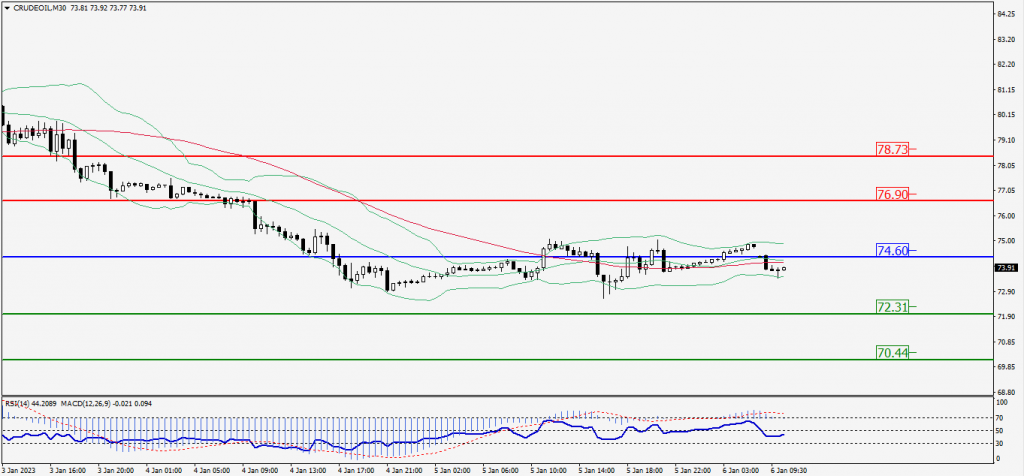
Green Lines Indicate Resistance Levels – Red Lines Indicate Support Levels
Light Blue is a Pivot Point – Black represents the price when the report was produced
XAU/USD Intraday: In a consolidation zone
Our pivot point is 1836.50
Preferable Price Action: Further upside to 1845.40 and 1852.10
Alternative Price Action: If the price gives an downside breakout of a pivot, then the price extends to 1828.20 and 1821.20.
Comment: MACD is at 50 level and Pairs below 55MA.
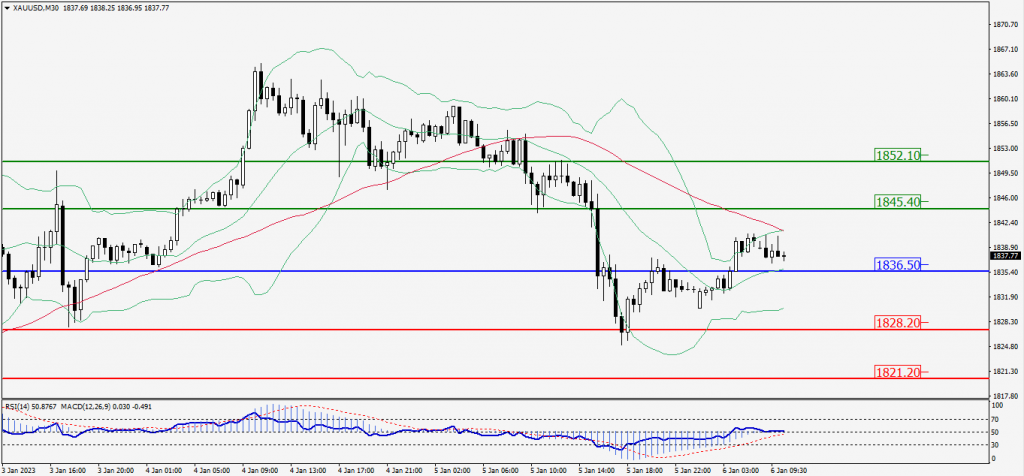
Green Lines Indicate Resistance Levels – Red Lines Indicate Support Levels
Light Blue is a Pivot Point – Black represents the price when the report was produced
Dow Jones Intraday: Trend on the downside
Our pivot point is 33,018.00
Preferable Price Action: Take sell positions down the pivot with targets at 32,889.00 & 32,796.00.
Alternative Price Action: Above 33,018.00 looks for further upside to 33,152.00 & 33,246.00.
Comment: RSI is below 50 levels and Pairs below 55MA.
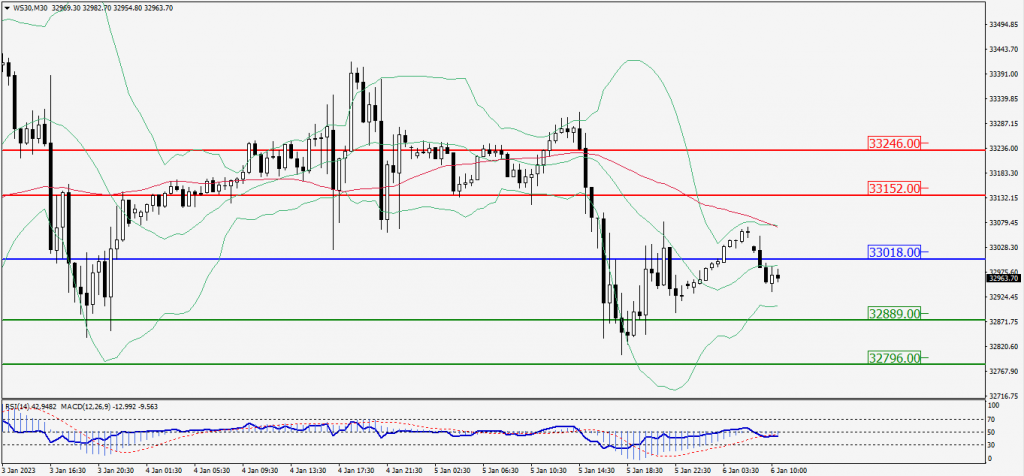
Green Lines Indicate Resistance Levels – Red Lines Indicate Support Levels
Light Blue is a Pivot Point – Black represents the price when the report was produced