Market Wrap: Stocks, Bonds, Commodities
Wall Street’s main indices closed lower on the first trading day of 2023 with the biggest drags from Tesla and Apple, while investors worried about the Federal Reserve’s interest-rate hiking path as they awaited minutes from its December meeting.
The Dow Jones Industrial Average fell 10.88 points to 33,136.37, the S&P 500 lose 0.40% to 3,824.14 and the Nasdaq Composite subtract 79.50 points to 10,386.99.
MSCI’s index of Asia-Pacific stocks outside Japan is advance 1.46% to 634.55 levels. The Australian index was higher by 1.63% to 7,059.20. Japanese Nikkei Index lose 1.45% today.
European stocks were positive on Wednesday, with the Stoxx Europe 50 Index rose 1.00% to 3,920.95, Germany’s DAX gain 1.04% to 14,329.45, and France’s CAC advanced 0.97% to 6,688.36, and U.K.’s FTSE 100 add 0.07% to 7,559.37.
Benchmark 10-year U.S. Treasury fell as demand for safe assets ascend again, today 10-year bond yields are negative 2.88% to 3.683.
Oil prices tumbled 3.5 percent in volatile trade on Tuesday, pressured by weak demand data from China, a gloomy economic outlook and a stronger US dollar.
Spot Brent crude oil fell 2.11% to $80.37 per barrel. US West Texas Intermediate crude is down 2.11% to $75.31 a barrel.
The yellow metal gold is advance 1.28% to 1,869.80 dollars per ounce.
Market Wrap: Forex
European stock markets are expected to open higher Wednesday, continuing the positive start to the new year ahead of the release of more important economic data.
Today, the U.S. dollar index measures the Greenback against a trade-weighted basket of six major currencies, which slipped 0.63% to 103.650.
The Euro US Dollar (EUR/USD) is a widely traded pair that is up 0.77% today. This left the pair trading around $1.0627.
The Japanese yen was negative against the U.S. dollar on Wednesday. Today USD/JPY is drop 0.72% to the 130.05 level.
Another commodity-related currency positive against the U.S dollar, AUD/USD rose 1.98% to 0.6866, and NZD/USD gain 1.53% to 0.6345 level.
EUR/USD Intraday: Trend on the upside
Our pivot point is at 1.05710
Preferable Price Action: Take long positions above pivot level with targets at 1.06100 & 1.06370 in extension.
Alternative Price Action: Below pivot looks for a further downside to 1.05290 & 1.05010.
Comment: RSI above 50 levels and Pairs above 20MA.
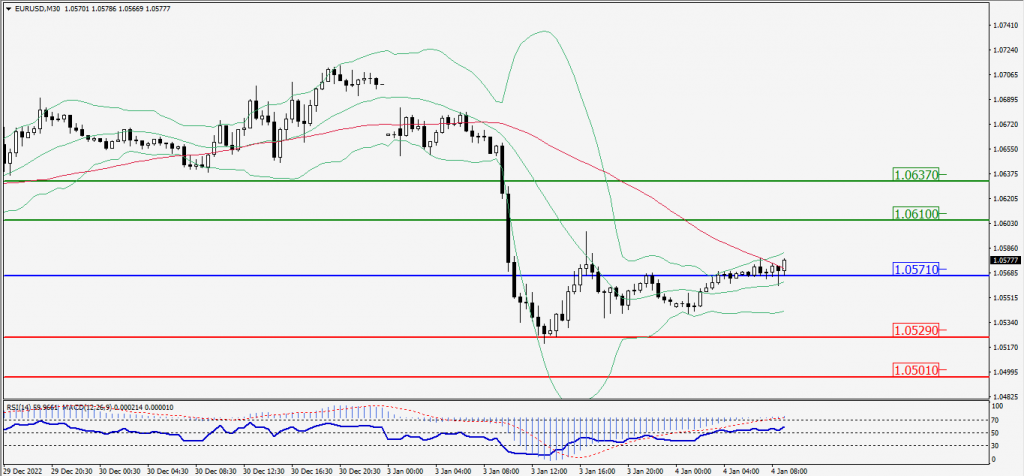
Green Lines Indicate Resistance Levels – Red Lines Indicate Support Levels
Light Blue is a Pivot Point – Black represents the price when the report was produced
GBP/USD Intraday: Major trend on the upside
Our pivot point is at 1.20000
Preferable Price Action: Buy positions above pivot with targets at 1.20530 & 1.20910 in extension.
Alternative Price Action: The price below pivot would call for further downside to 1.19080 & 1.19070.
Comment: RSI is above 50 levels and Pairs above 20MA.
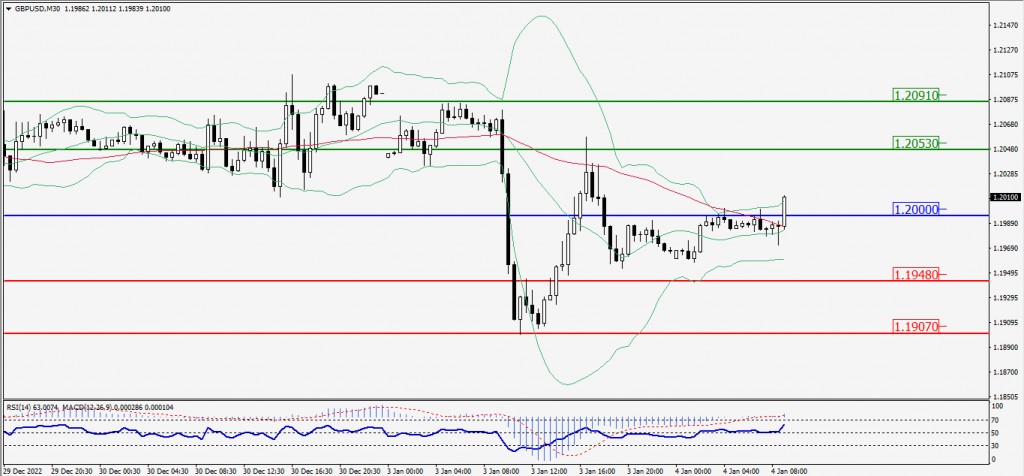
Green Lines Indicate Resistance Levels – Red Lines Indicate Support Levels
Light Blue is a Pivot Point – Black represents the price when the report was produced
USD/JPY Intraday: Resistance level at 130.840
Our pivot point is at 130.840
Preferable Price Action: Sell position below pivot with the target at 129.730 and 129.050 in extension.
Alternative Price Action: The upside breakout of the pivot would call for 131.950 and 132.690.
Comment: MACD is negative territory and Pairs below 20MA.
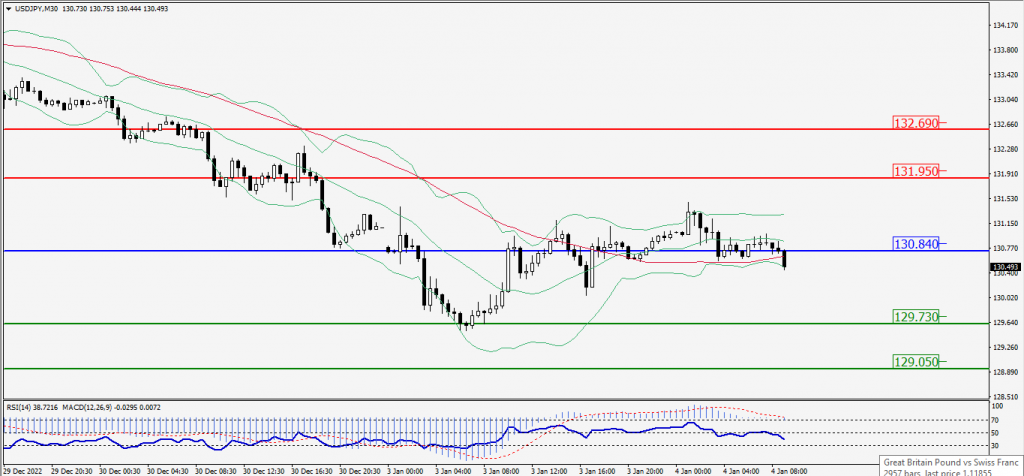
Green Lines Indicate Resistance Levels – Red Lines Indicate Support Levels
Light Blue is a Pivot Point – Black represents the price when the report was produced
AUD/USD Intraday: Major trend on the upside
Our pivot point is at 0.68150
Preferable Price Action: Buy Positions above pivot with targets at 0.68790 & 0.69200 in extension.
Alternative Price Action: Below pivot looks for a further downside with 0.67550 & 0.67130 as targets.
Comment: RSI is above 50 levels and pairs above it’s 20MA & 55MA.
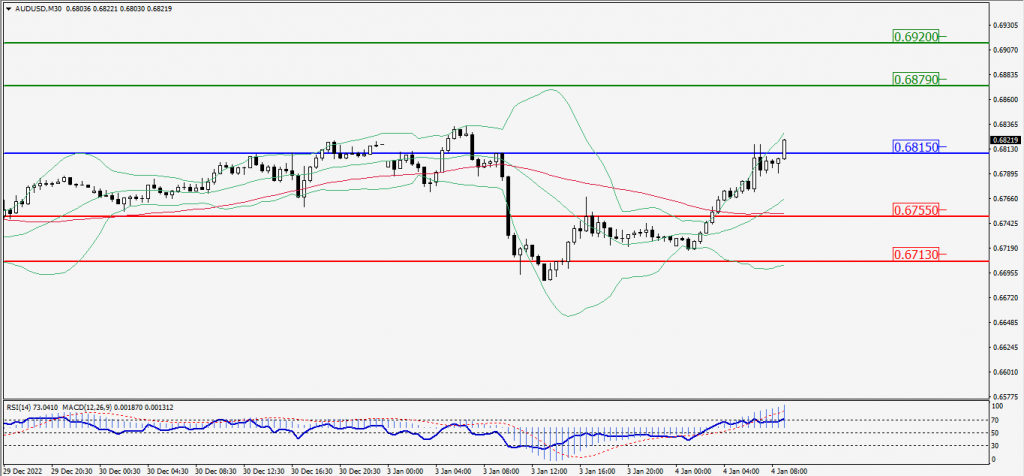
Green Lines Indicate Resistance Levels – Red Lines Indicate Support Levels
Light Blue is a Pivot Point – Black represents the price when the report was produced
CRUDEOIL Intraday: Major trend on the downside
Our pivot point is at 77.28
Preferable Price Action: Below pivots sell oil with 75.13 & 73.59 as targets.
Alternative Price Action: Buy crude up pivot with targets at 79.47 and 80.96 in extension.
Comment: MACD is negative territory and Pairs below it’s 20MA & 55MA.
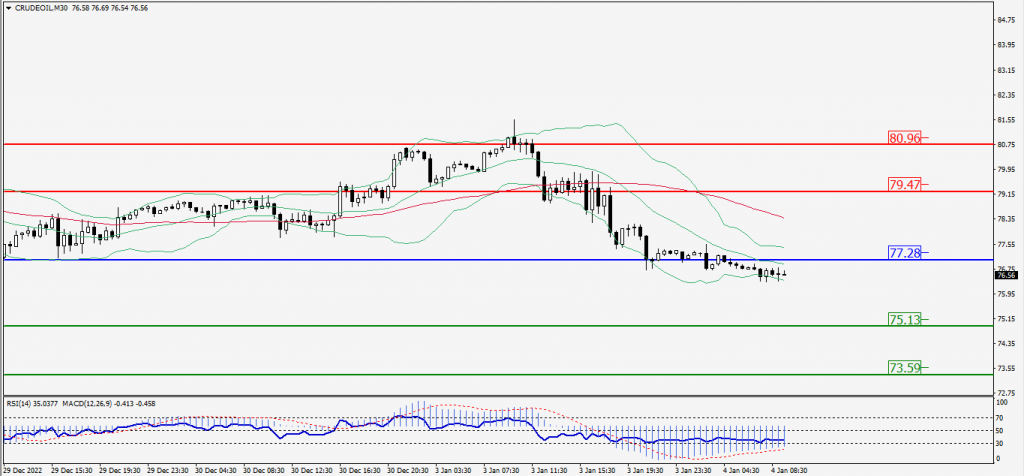
Green Lines Indicate Resistance Levels – Red Lines Indicate Support Levels
Light Blue is a Pivot Point – Black represents the price when the report was produced
XAU/USD Intraday: Major trend on the upside
Our pivot point is 1854.80
Preferable Price Action: Further upside to 1878.40 and 1895.70
Alternative Price Action: If the price gives an downside breakout of a pivot, then the price extends to 1832.00 and 1814.70.
Comment: MACD is above 50 level and Pairs above it’s 20MA & 55MA.
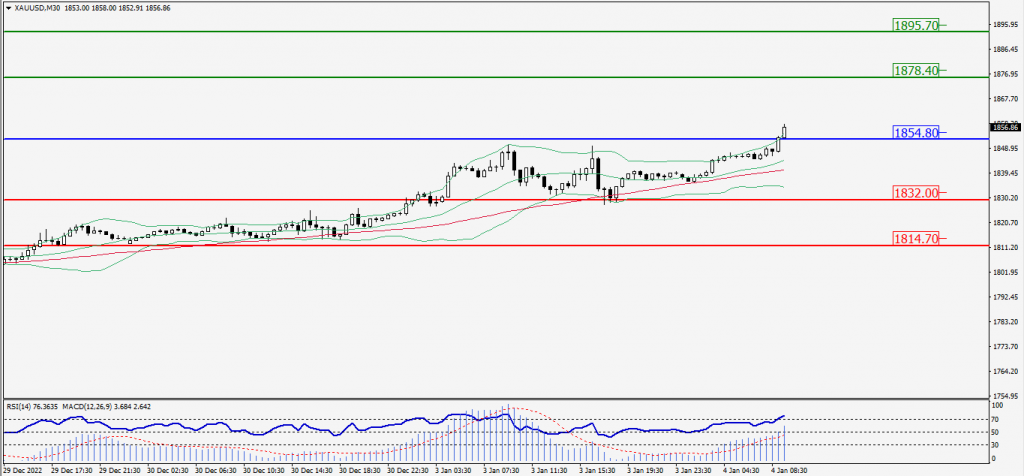
Green Lines Indicate Resistance Levels – Red Lines Indicate Support Levels
Light Blue is a Pivot Point – Black represents the price when the report was produced
Dow Jones Intraday: Trend on the upside
Our pivot point is 33,168.00
Preferable Price Action: Take buy positions up the pivot with targets at 33,307.00 & 33,422.00.
Alternative Price Action: Below 33,168.00 looks for further downside to 33,026.00 & 33,915.00.
Comment: RSI is above 50 levels and Pairs above 20MA &.
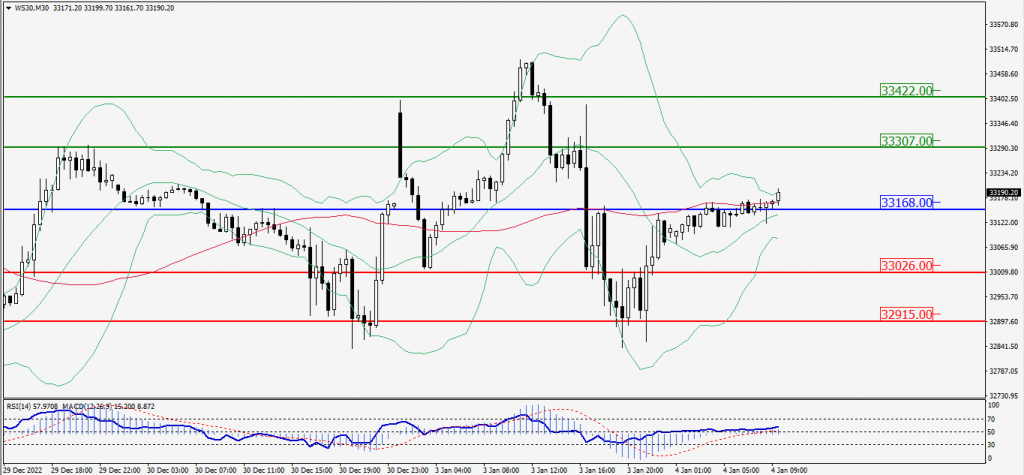
Green Lines Indicate Resistance Levels – Red Lines Indicate Support Levels
Light Blue is a Pivot Point – Black represents the price when the report was produced