Market Wrap: Stocks, Bonds, Commodities
Wall Street closed slightly higher on Tuesday after four sessions of declines, but investors fretted about weak holiday shopping and rising bond yields added pressure after the Bank of Japan’s (BOJ) surprise tweak of monetary policy.
The Dow Jones Industrial Average rose 92.20 points to 32,849.74, the S&P 500 gain 0.10% to 3,821.62 and the Nasdaq Composite add 1.08 points to 10,547.11.
MSCI’s index of Asia-Pacific stocks outside Japan is advance 0.07% to 615.57 levels. The Australian index was higher by 1.29% to 7,115.10. Japanese Nikkei Index lose 0.68% today.
European stocks were positive on Wednesday, with the Stoxx Europe 50 Index rose 0.29% to 3,813.55, Germany’s DAX gain 0.30% to 13,926.85, and France’s CAC advance 0.35% to 6,473.29, and U.K.’s FTSE 100 add 0.18% to 7,383.62.
Benchmark 10-year U.S. Treasury fell as demand for safe assets ascend again, today 10-year bond yields are negative 0.10% to 3.681.
Oil prices ended mostly flat on Tuesday in a volatile session as a worsening outlook for a major US winter storm sparked fears that millions of Americans might curb travel plans during the holiday season.
Spot Brent crude oil fell 0.23% to $79.81 per barrel. US West Texas Intermediate crude is up 0.35% to $75.96 a barrel.
The yellow metal gold is decline 0.07% to 1,824.05 dollars per ounce.
Market Wrap: Forex
European stock markets are expected to open higher Wednesday, rebounding after the previous session’s weakness as consumer sentiment picked up in Germany, the Eurozone’s dominant economy.
Today, the U.S. dollar index measures the Greenback against a trade-weighted basket of six major currencies, which surge 0.04% to 103.650.
The Euro US Dollar (EUR/USD) is a widely traded pair that is up 0.05% today. This left the pair trading around $1.0626.
The Japanese yen was positive against the U.S. dollar on Wednesday. Today USD/JPY is ascend 0.06% to the 131.78 level.
Another commodity-related currency negative against the U.S dollar, AUD/USD fell 0.01% to 0.6676, and NZD/USD lose 0.76% to 0.6299 level.
EUR/USD Intraday: Trend on the downside
Our pivot point is at 1.06190
Preferable Price Action: Take short positions below pivot level with targets at 1.06060 & 1.05950 in extension.
Alternative Price Action: Above pivot looks for a further upside to 1.06320 & 1.06430.
Comment: RSI below 50 levels and Pairs below 20MA & 55MA.
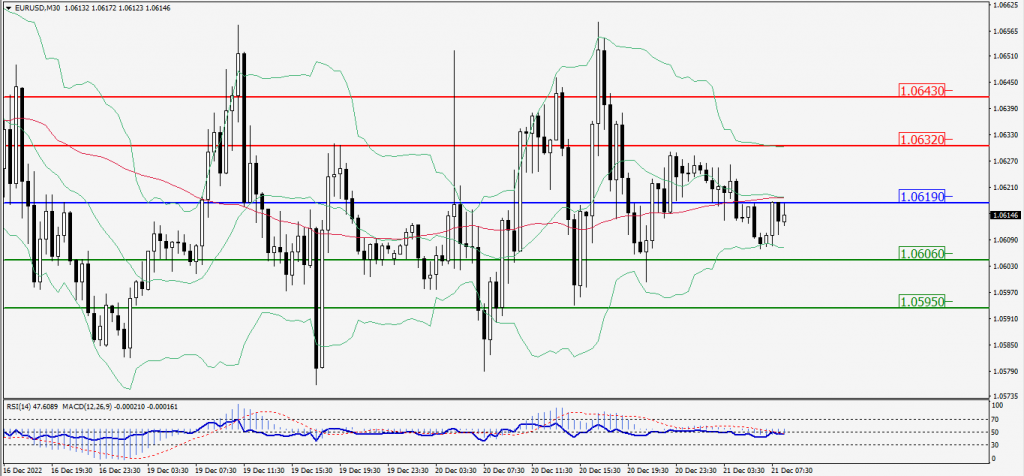
Green Lines Indicate Resistance Levels – Red Lines Indicate Support Levels
Light Blue is a Pivot Point – Black represents the price when the report was produced
GBP/USD Intraday: Trend on the downside
Our pivot point is at 1.21650.
Preferable Price Action: Sell positions below pivot with targets at 1.21390 & 1.21210 in extension.
Alternative Price Action: The price above pivot would call for further upside to 1.21920 & 1.22090.
Comment: RSI is below 50 levels and Pairs below 20MA.
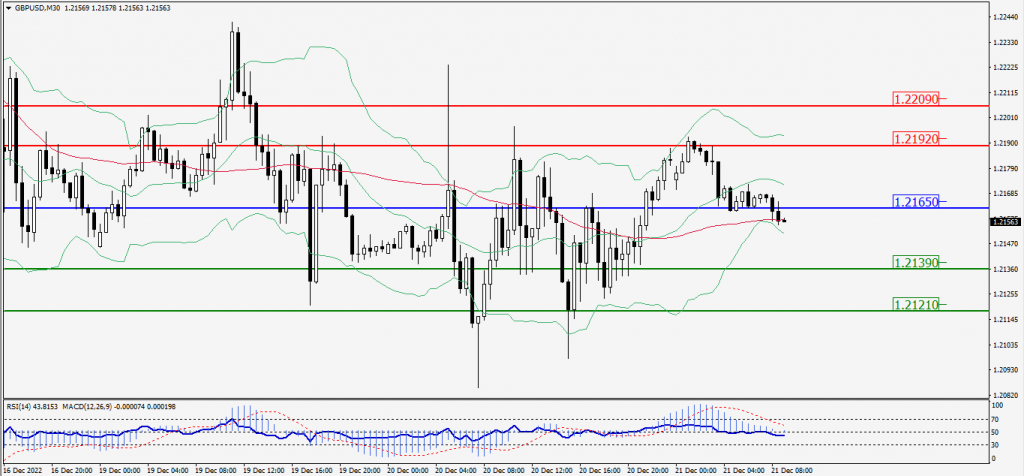
Green Lines Indicate Resistance Levels – Red Lines Indicate Support Levels
Light Blue is a Pivot Point – Black represents the price when the report was produced
USD/JPY Intraday: Trend on the upside
Our pivot point is at 131.830
Preferable Price Action: Buy position above pivot with the target at 133.340 and 134.330 in extension.
Alternative Price Action: The downside breakout of the pivot would call for 130.470 and 129.420.
Comment: MACD is positive territory and Pairs above 20MA.
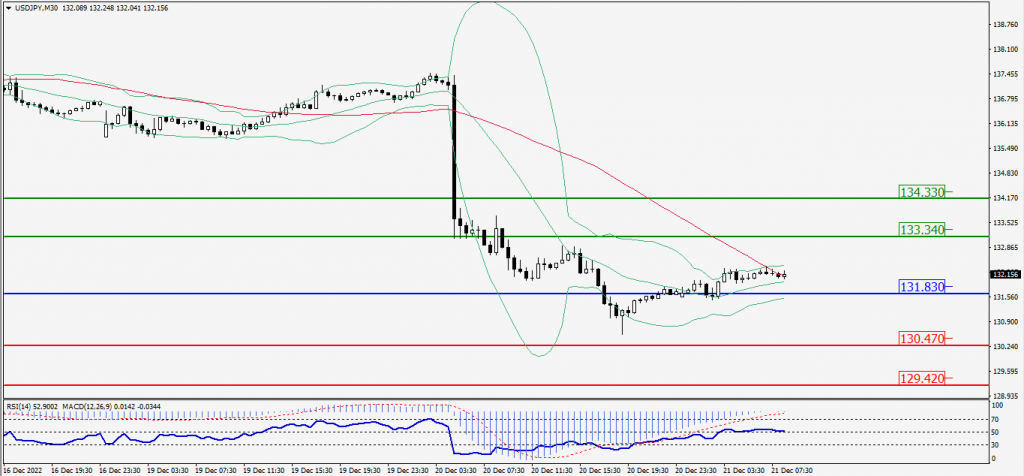
Green Lines Indicate Resistance Levels – Red Lines Indicate Support Levels
Light Blue is a Pivot Point – Black represents the price when the report was produced
AUD/USD Intraday: Trend on the downside
Our pivot point is at 0.66720
Preferable Price Action: Sell Positions below pivot with targets at 0.66520 & 0.66380 in extension.
Alternative Price Action: Below pivot looks for a further downside with 0.66920 & 0.67060 as targets.
Comment: RSI is below 50 levels and pairs below 20MA.
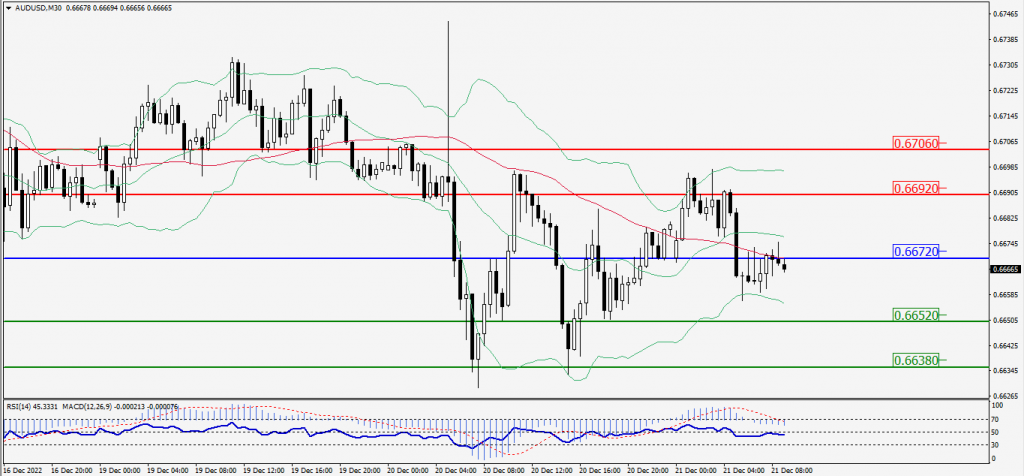
Green Lines Indicate Resistance Levels – Red Lines Indicate Support Levels
Light Blue is a Pivot Point – Black represents the price when the report was produced
CRUDEOIL Intraday: Trend on the upside
Our pivot point is at 76.17.
Preferable Price Action: Above pivots buy oil with 77.15 & 77.84 as targets.
Alternative Price Action: Sell crude down pivot with targets at 75.20 and 74.54 in extension.
Comment: MACD is positive territory and Pairs above 55MA.
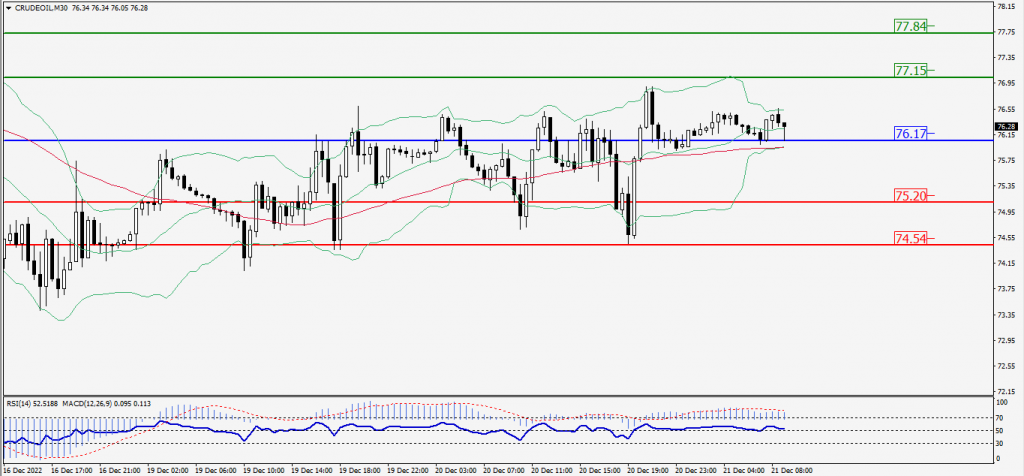
Green Lines Indicate Resistance Levels – Red Lines Indicate Support Levels
Light Blue is a Pivot Point – Black represents the price when the report was produced
XAU/USD Intraday: Trend on the downside
Our pivot point is 1818.00
Preferable Price Action: Further downside to 1806.10 and 1796.10
Alternative Price Action: If the price gives an upside breakout of a pivot, then the price extends to 1830.00 and 1840.10.
Comment: MACD is negative territory and Pairs below 20MA.
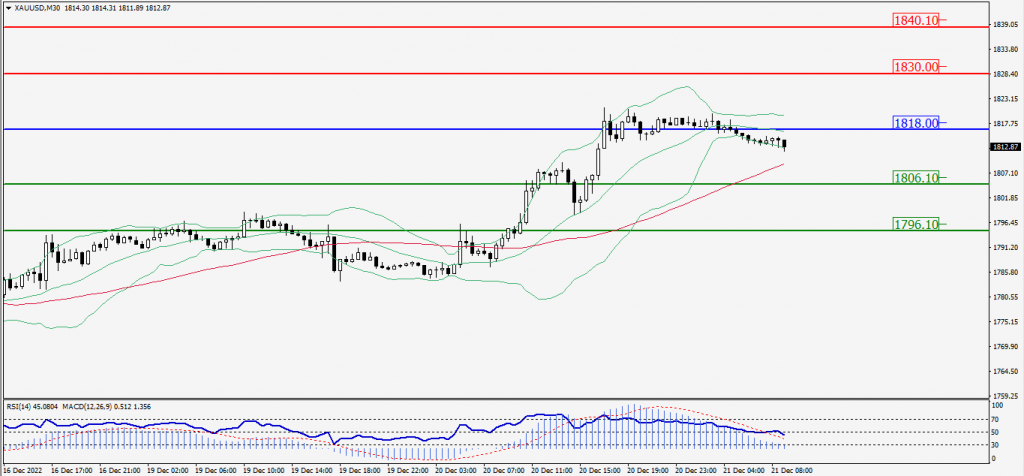
Green Lines Indicate Resistance Levels – Red Lines Indicate Support Levels
Light Blue is a Pivot Point – Black represents the price when the report was produced
Dow Jones Intraday: Trend on the upside
Our pivot point is 32,994.00
Preferable Price Action: Take buy positions up the pivot with targets at 33,187.00 & 33,330.00.
Alternative Price Action: Below 32,994.00 looks for further downside to 32,805.00 & 32,657.00.
Comment: RSI is above 50 levels and Pairs above 55MA.
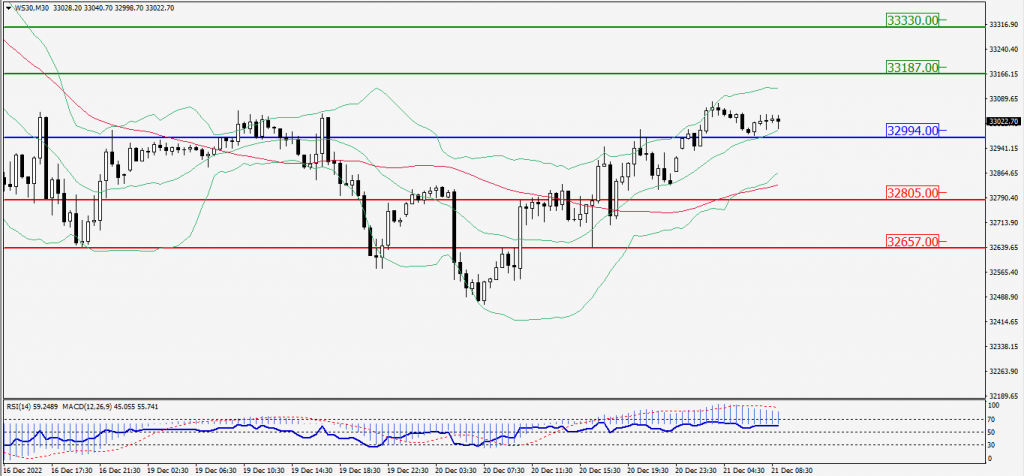
Green Lines Indicate Resistance Levels – Red Lines Indicate Support Levels
Light Blue is a Pivot Point – Black represents the price when the report was produced