Market Wrap: Stocks, Bonds, Commodities
US stocks closed lower in volatile trading on Wednesday following a policy announcement by the Federal Reserve that raised interest rates by an expected 50 basis points, but its economic projections see higher rates for a longer period.
The Dow Jones Industrial Average fell 142.29 points to 33,966.35, the S&P 500 lose 0.61% to 3,995.32 and the Nasdaq Composite subtract 85.93 points to 11,170.89.
MSCI’s index of Asia-Pacific stocks outside Japan is decline 1.13% to 628.01 levels. The Australian index was lower by 0.64% to 7,204.80. Japanese Nikkei Index lose 0.37% today.
European stocks were negative on Thursday, with the Stoxx Europe 50 Index fell 0.29% to 3,975.26, Germany’s DAX lose 0.26% to 14,460.20, and France’s CAC decline 0.21% to 6,730.79, and U.K.’s FTSE 100 subtract 0.09% to 7,495.93.
Benchmark 10-year U.S. Treasury fell as demand for safe assets ascend again, today 10-year bond yields are negative 0.32% to 3.492.
Oil prices rose more than $2 on Wednesday after OPEC and the International Energy Agency (IEA) both forecast a rebound in demand over the course of next year and as U.S. rate hikes are expected to ease alongside slowing inflation.
Spot Brent crude oil fell 0.86% to $81.99 per barrel. US West Texas Intermediate crude is down 1.05% to $76.47 a barrel.
The yellow metal gold is decline 1.08% to 1,799.10 dollars per ounce.
Market Wrap: Forex
European stock markets are expected to open lower Thursday, after hawkish rhetoric from the U.S. Federal Reserve and amid caution ahead of more central banks meetings in Europe and the U.K.
Today, the U.S. dollar index measures the Greenback against a trade-weighted basket of six major currencies, which surge 0.18% to 103.595.
The Euro US Dollar (EUR/USD) is a widely traded pair that is down 0.38% today. This left the pair trading around $1.0641.
The Japanese yen was positive against the U.S. dollar on Thursday. Today USD/JPY is ascend 0.29% to the 135.87 level.
Another commodity-related currency negative against the U.S dollar, AUD/USD fell 0.74% to 0.6812, and NZD/USD lose 0.57% to 0.6417 level.
EUR/USD Intraday: In a consolidation zone
Our pivot point is at 1.06870
Preferable Price Action: Take short positions below pivot level with targets at 1.05910 & 1.05160 in extension.
Alternative Price Action: Above pivot looks for a further upside to 1.07860 & 1.08570.
Comment: RSI is at 50 levels and Pairs below 20MA .
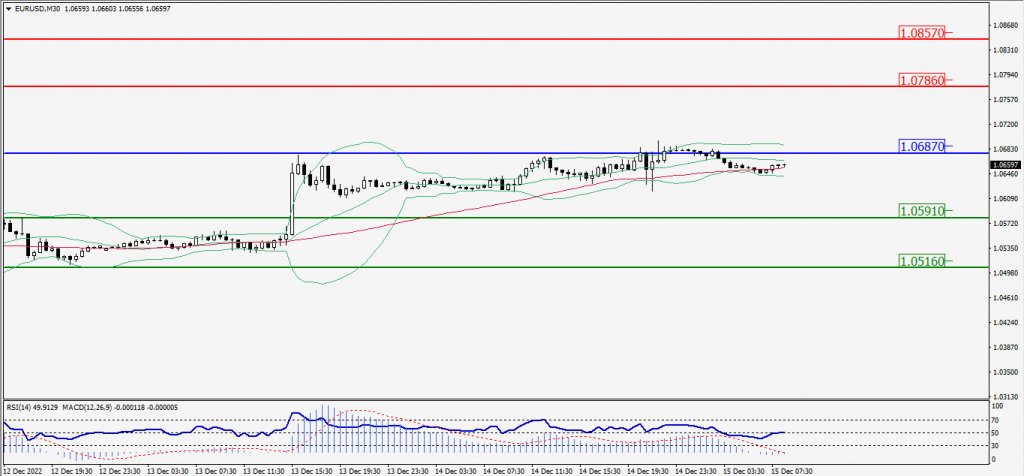
Green Lines Indicate Resistance Levels – Red Lines Indicate Support Levels
Light Blue is a Pivot Point – Black represents the price when the report was produced
GBP/USD Intraday: Resistance level at 1.24190
Our pivot point is at 1.24190
Preferable Price Action: Sell positions below pivot with targets at 1.23530 & 1.23020 in extension.
Alternative Price Action: The price above pivot would call for further upside to 1.24850 & 1.25380.
Comment: RSI is at 50 levels and Pairs below 20MA.
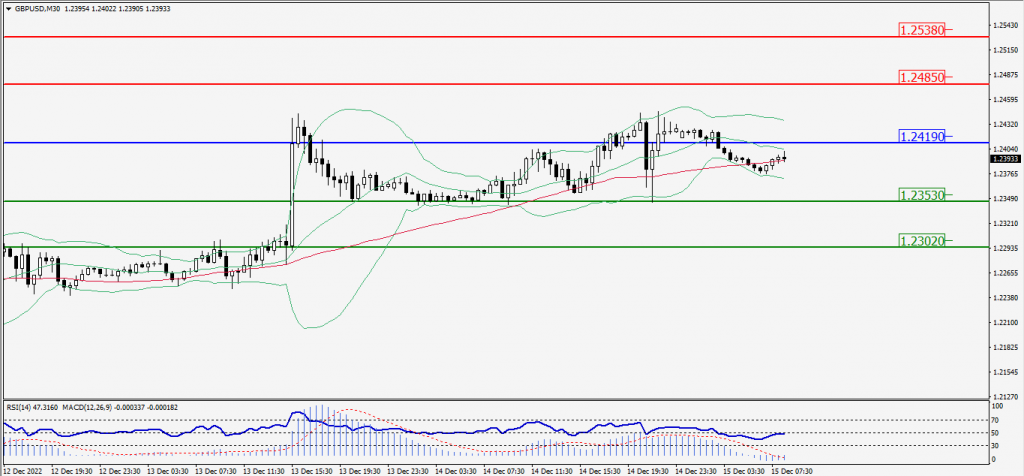
Green Lines Indicate Resistance Levels – Red Lines Indicate Support Levels
Light Blue is a Pivot Point – Black represents the price when the report was produced
USD/JPY Intraday: Trend on the upside
Our pivot point is at 135.420
Preferable Price Action: Buy position above pivot with the target at 136.520 and 137.290 in extension.
Alternative Price Action: The downside breakout of the pivot would call for 134.360 and 133.650.
Comment: MACD is positive territory and Pairs above 55MA.
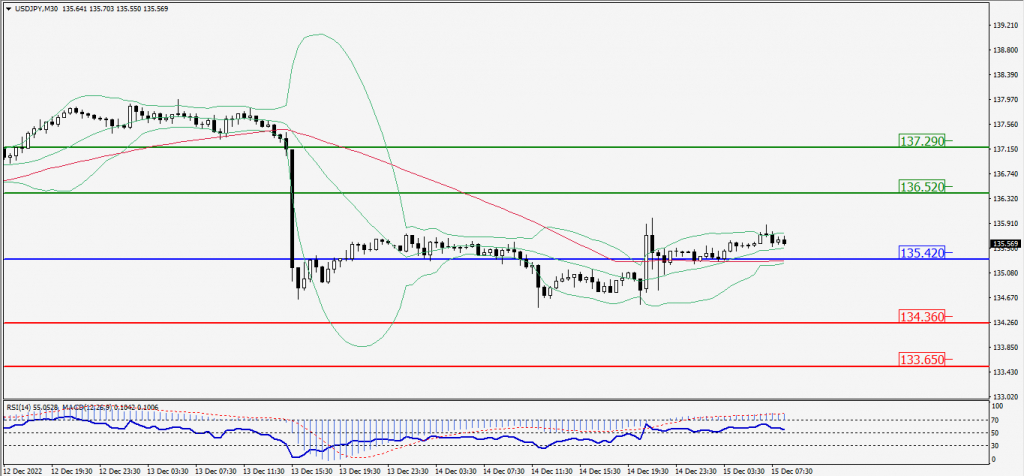
Green Lines Indicate Resistance Levels – Red Lines Indicate Support Levels
Light Blue is a Pivot Point – Black represents the price when the report was produced
AUD/USD Intraday: Trend on the downside
Our pivot point is at 0.68350
Preferable Price Action: Sell Positions below pivot with targets at 0.68030 & 0.67800 in extension.
Alternative Price Action: Above pivot looks for a further upside with 0.68660 & 0.68890 as targets.
Comment: RSI below 50 levels and Pairs below 20MA & 55MA.
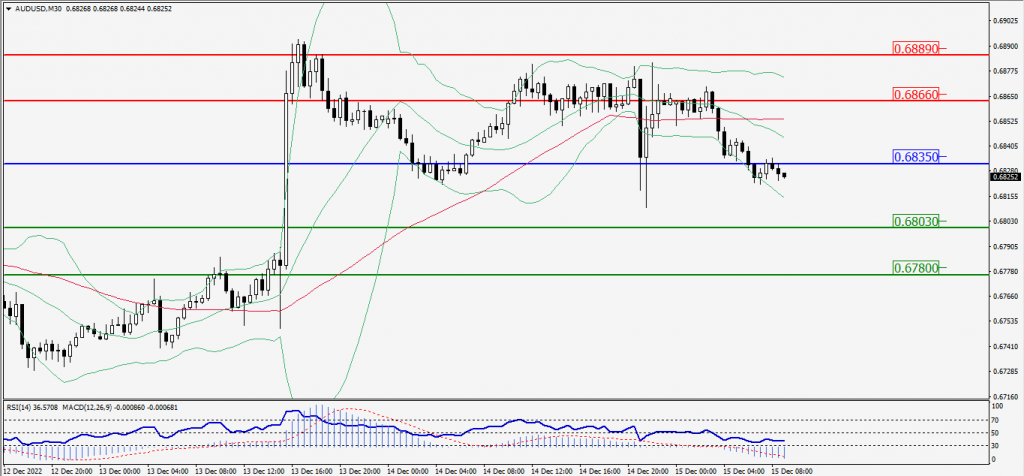
Green Lines Indicate Resistance Levels – Red Lines Indicate Support Levels
Light Blue is a Pivot Point – Black represents the price when the report was produced
CRUDEOIL Intraday: Trend on the downside
Our pivot point is at 77.45.
Preferable Price Action: Below pivots sell oil with 74.91 & 72.91 as targets.
Alternative Price Action: Buy crude up pivot with targets at 80.05 and 82.08 in extension.
Comment: MACD is negative territory and Pairs below 20MA.
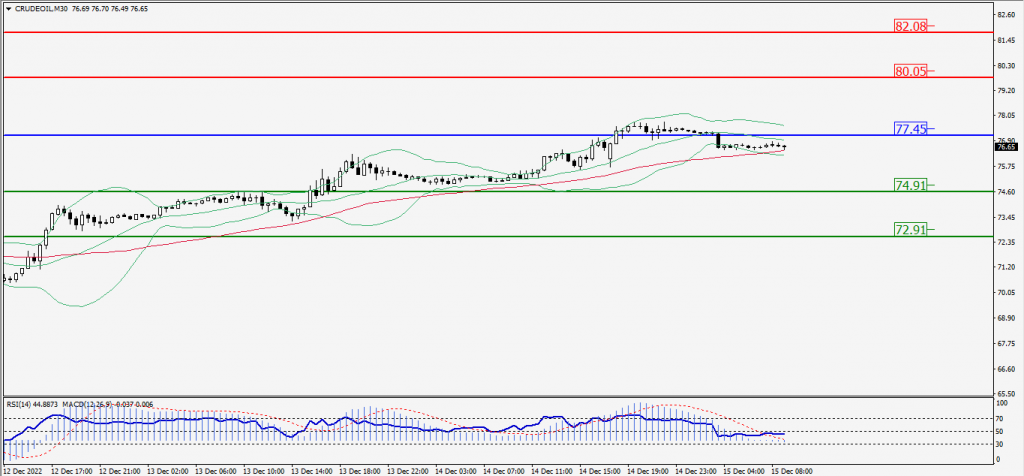
Green Lines Indicate Resistance Levels – Red Lines Indicate Support Levels
Light Blue is a Pivot Point – Black represents the price when the report was produced
XAU/USD Intraday: Trend on the downside
Our pivot point is 1796.30
Preferable Price Action: Further downside to 1788.30 and 1782.30
Alternative Price Action: If the price gives a upside breakout of a pivot, then the price extends to 1804.40 and 1810.80.
Comment: MACD is negative territory and Pairs below 20MA & 55MA.
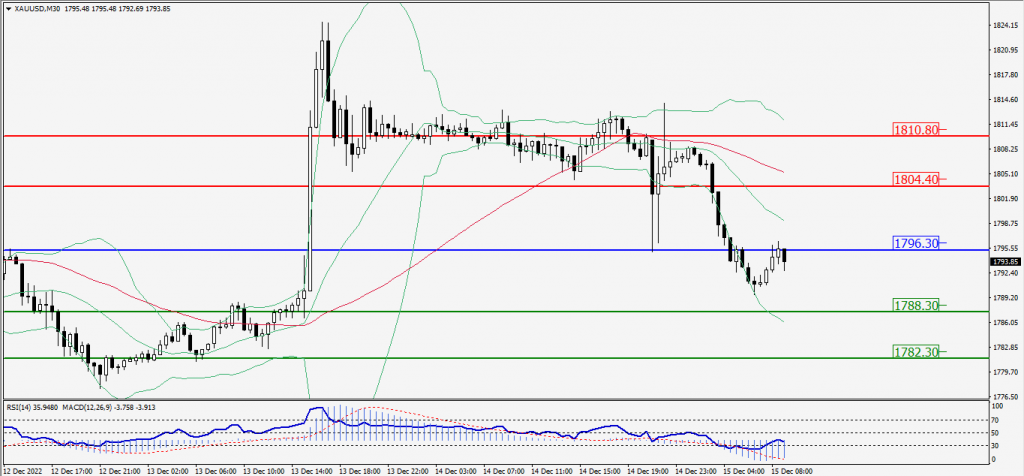
Green Lines Indicate Resistance Levels – Red Lines Indicate Support Levels
Light Blue is a Pivot Point – Black represents the price when the report was produced
Dow Jones Intraday: Trend on the downside
Our pivot point is 34,061.00
Preferable Price Action: Take sell positions below the pivot with targets at 33,626.00 & 33,327.00.
Alternative Price Action: Above 34,061.00 looks for further upside to 34,501.00 & 34,800.00.
Comment: RSI below 50 levels and Pairs below 20MA & 55MA.
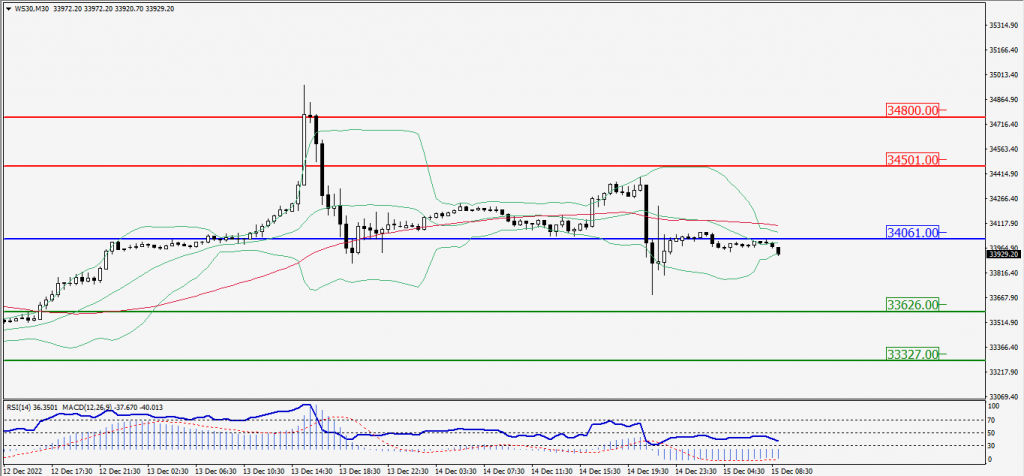
Green Lines Indicate Resistance Levels – Red Lines Indicate Support Levels
Light Blue is a Pivot Point – Black represents the price when the report was produced