Market Wrap: Stocks, Bonds, Commodities
Asia-Pacific markets traded higher on Wednesday, after stocks on Wall Street saw a second day of gains on an inflation print that came in cooler than expected.
The Dow Jones Industrial Average rose 103.60 points to 34,108.64, the S&P 500 gain 0.73% to 4,019.65 and the Nasdaq Composite add 113.08 points to 11,256.81.
MSCI’s index of Asia-Pacific stocks outside Japan is ascend 1.08% to 635.03 levels. The Australian index was higher by 0.67% to 7,251.30. Japanese Nikkei Index gain 0.75% today.
European stocks were positive on Wednesday, with the Stoxx Europe 50 Index rose 1.66% to 3,986.83, Germany’s DAX gain 1.34% to 14,497.89, and France’s CAC advance 1.42% to 6,744.98, and U.K.’s FTSE 100 add 0.76% to 7,502.89.
Benchmark 10-year U.S. Treasury fell as demand for safe assets ascend again, today 10-year bond yields are negative 0.94% to 3.470.
Oil rose to more than $80 a barrel on Tuesday as investors bought up risk assets after US data pointed to slowing inflation.
Spot Brent crude oil fell 0.11% to $80.59 per barrel. US West Texas Intermediate crude is down 0.08% to $75.33 a barrel.
The yellow metal gold is decline 0.27% to 1,820.60 dollars per ounce.
Market Wrap: Forex
The U.S. dollar stabilized in early European trade Wednesday ahead of the Federal Reserve’s rate decision after a sharp drop overnight in the wake of cooler-than-expected inflation data.
Today, the U.S. dollar index measures the Greenback against a trade-weighted basket of six major currencies, which surge 0.06% to 103.625.
The Euro US Dollar (EUR/USD) is a widely traded pair that is down 0.02% today. This left the pair trading around $1.0630.
The Japanese yen was negative against the U.S. dollar on Wednesday. Today USD/JPY is drop 0.06% to the 135.49 level.
Another commodity-related currency negative against the U.S dollar, AUD/USD fell 0.02% to 0.6854, and NZD/USD lose 0.36% to 0.6439 level.
EUR/USD Intraday: Trend on the upside
Our pivot point is at 1.06290
Preferable Price Action: Take long positions above pivot level with targets at 1.06950 & 1.07350 in extension.
Alternative Price Action: Below pivot looks for a further downside to 1.05640 & 1.05230.
Comment: RSI above 50 levels and Pairs above 22MA & 55MA.
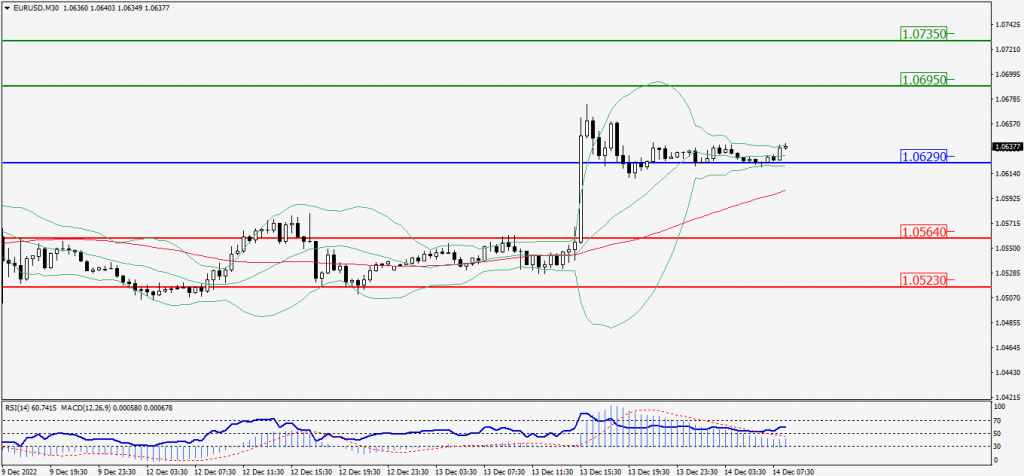
Green Lines Indicate Resistance Levels – Red Lines Indicate Support Levels
Light Blue is a Pivot Point – Black represents the price when the report was produced
GBP/USD Intraday: Support level at 1.23590
Our pivot point is at 1.23590
Preferable Price Action: Buy positions above pivot with targets at 1.24270 & 1.24680 in extension.
Alternative Price Action: The price below pivot would call for further downside to 1.22980 & 1.22570.
Comment: RSI above 50 levels and Pairs above 20MA & 55MA.
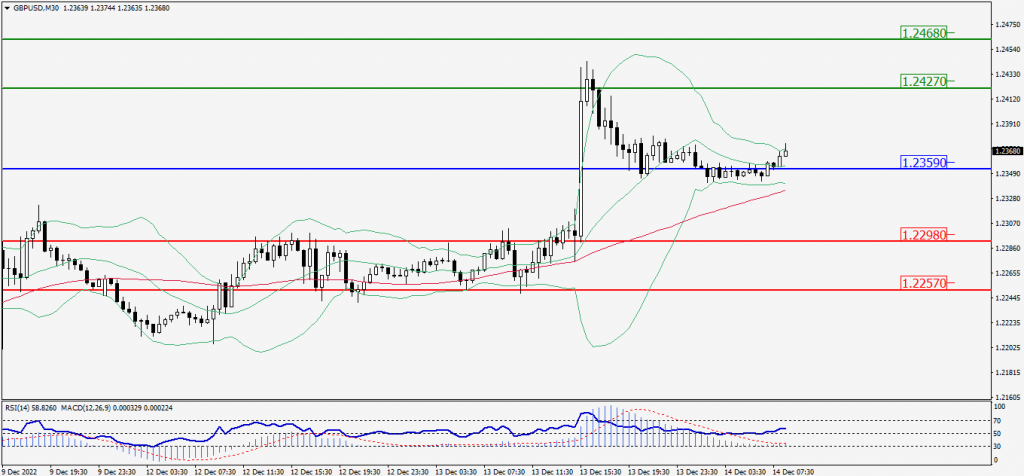
Green Lines Indicate Resistance Levels – Red Lines Indicate Support Levels
Light Blue is a Pivot Point – Black represents the price when the report was produced
USD/JPY Intraday: Trend on the downside
Our pivot point is at 135.860
Preferable Price Action: Sell position below pivot with the target at 134.440 and 133.510 in extension.
Alternative Price Action: The upside breakout of the pivot would call for 137.230 and 138.150.
Comment: MACD is negative territory and Pairs below 55MA.
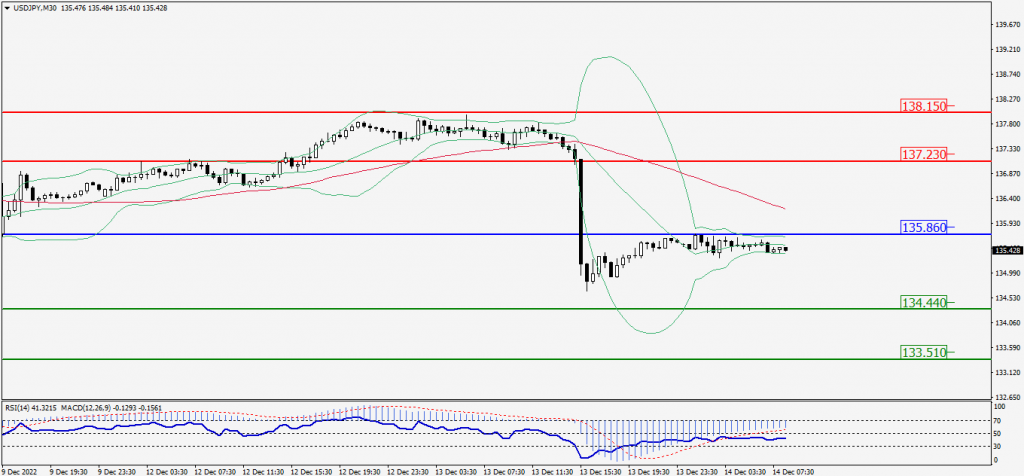
Green Lines Indicate Resistance Levels – Red Lines Indicate Support Levels
Light Blue is a Pivot Point – Black represents the price when the report was produced
AUD/USD Intraday: Trend on the upside
Our pivot point is at 0.68410
Preferable Price Action: Buy Positions above pivot with targets at 0.68860 & 0.69170 in extension.
Alternative Price Action: Below pivot looks for a further downside with 0.67950 & 0.67640 as targets.
Comment: RSI above 50 levels and Pairs above 22MA & 55MA.
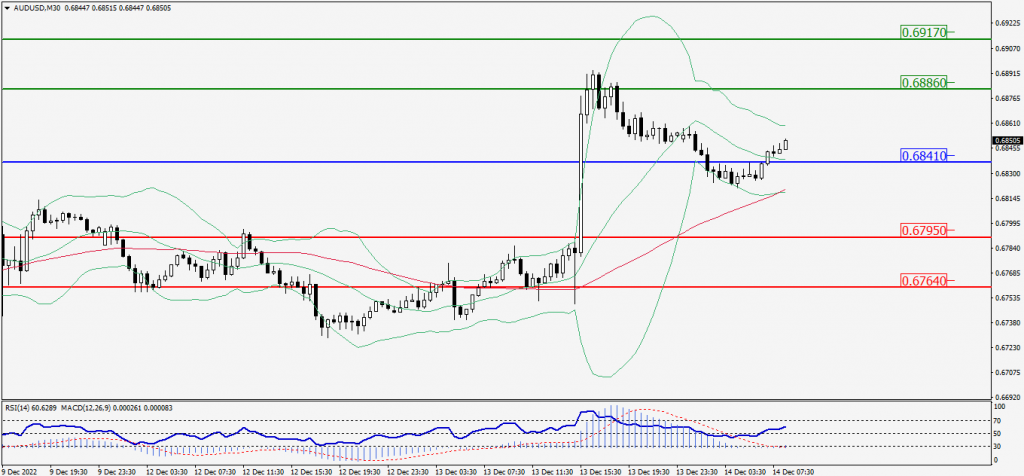
Green Lines Indicate Resistance Levels – Red Lines Indicate Support Levels
Light Blue is a Pivot Point – Black represents the price when the report was produced
CRUDEOIL Intraday: Trend on the upside
Our pivot point is at 74.98.
Preferable Price Action: Above pivots buy oil with 76.97 & 78.30 as targets.
Alternative Price Action: Sell crude below pivot with targets at 72.96 and 71.61 in extension.
Comment: MACD is positive territory and Pairs above 55MA.
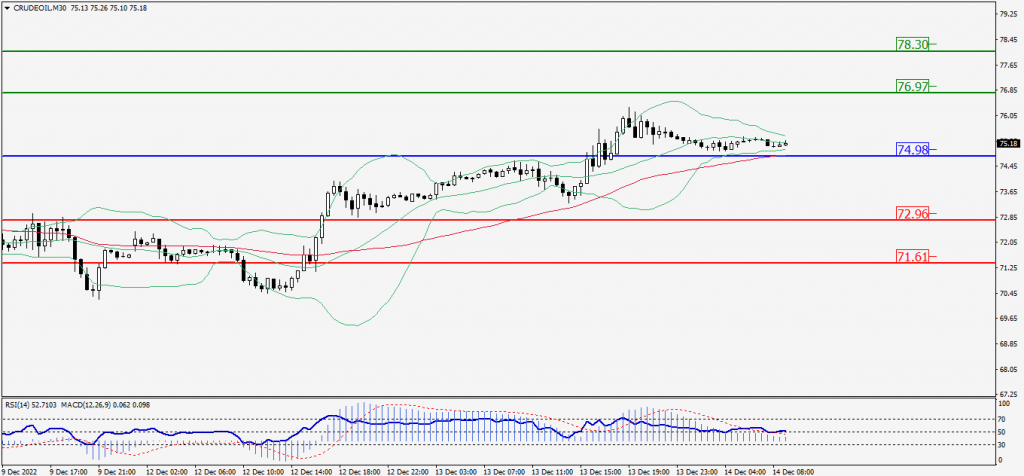
Green Lines Indicate Resistance Levels – Red Lines Indicate Support Levels
Light Blue is a Pivot Point – Black represents the price when the report was produced
XAU/USD Intraday: Trend on the upside
Our pivot point is 1809.10
Preferable Price Action: Further upside to 1823.80 and 1832.70
Alternative Price Action: If the price gives a downside breakout of a pivot, then the price extends to 1794.50 and 1786.30.
Comment: MACD is positive territory and Pairs above 55MA.
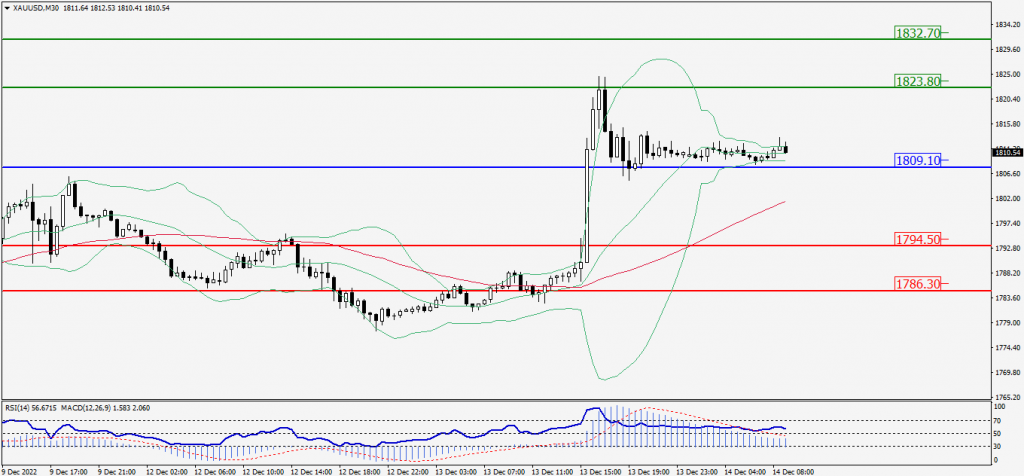
Green Lines Indicate Resistance Levels – Red Lines Indicate Support Levels
Light Blue is a Pivot Point – Black represents the price when the report was produced
Dow Jones Intraday: Trend on the upside
Our pivot point is 34,131.00
Preferable Price Action: Take buy positions above the pivot with targets at 34,418.00 & 34,626.00.
Alternative Price Action: Below 34,131.00 looks for further downside to 33,870.00 & 33,668.00.
Comment: RSI above 50 levels and Pairs above 55MA.
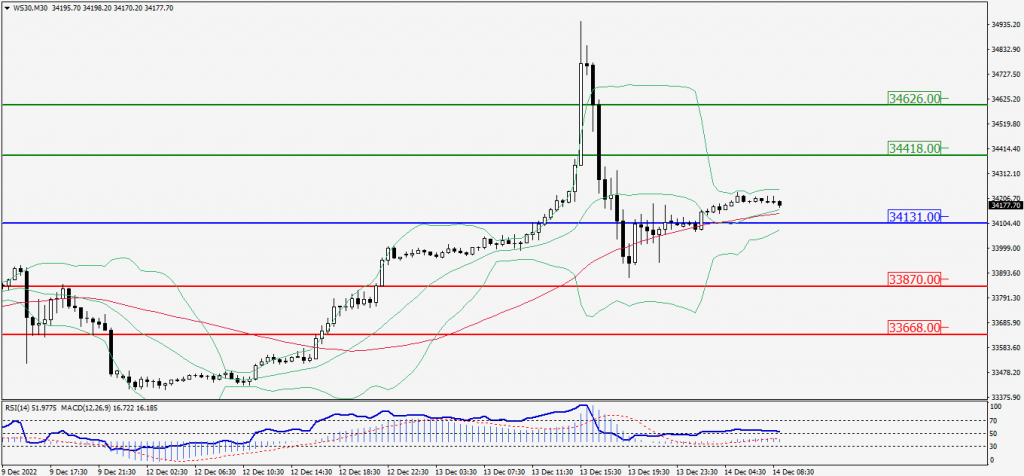
Green Lines Indicate Resistance Levels – Red Lines Indicate Support Levels
Light Blue is a Pivot Point – Black represents the price when the report was produced