Market Wrap: Stocks, Bonds, Commodities
The S&P 500 ended higher on Tuesday, snapping a five-session losing streak, as investors interpreted data showing a rise in weekly jobless claims as a sign the pace of interest rate hikes could soon slow.
The Dow Jones Industrial Average rose 528.58 points to 34,005.04, the S&P 500 gain 1.43% to 3,990.56 and the Nasdaq Composite add 139.12 points to 11,143.74.
MSCI’s index of Asia-Pacific stocks outside Japan is ascend 1.32% to 635.72 levels. The Australian index was higher by 0.31% to 7,203.30. Japanese Nikkei Index gain 0.40% today.
European stocks were mix on Tuesday, with the Stoxx Europe 50 Index rose 0.15% to 3,927.75, Germany’s DAX lose 0.05% to 14,319.45, and France’s CAC decline 0.02% to 6,648.57, and U.K.’s FTSE 100 add 0.07% to 7,451.95.
Benchmark 10-year U.S. Treasury fell as demand for safe assets ascend again, today 10-year bond yields are negative 0.56% to 3.591.
Oil prices rose more than 1% in early Asian trade on Monday as a key Canada-United States crude pipeline stayed shut while Russian President Vladimir Putin threatened to cut production in retaliation against a Western price cap on Russian oil exports.
Spot Brent crude oil rose 1.58% to $79.22 per barrel. US West Texas Intermediate crude is up 1.33% to $74.14 a barrel.
The yellow metal gold is advance 0.27% to 1,797.95 dollars per ounce.
Market Wrap: Forex
The U.S. dollar edged lower in early European trade Tuesday amid caution ahead of the release of the latest U.S. consumer inflation and the final Federal Reserve meeting of the year.
Today, the U.S. dollar index measures the Greenback against a trade-weighted basket of six major currencies, which slipped 0.18% to 104.575.
The Euro US Dollar (EUR/USD) is a widely traded pair that is up 0.06% today. This left the pair trading around $1.0539.
The Japanese yen was positive against the U.S. dollar on Tuesday. Today USD/JPY is ascend 0.05% to the 137.61 level.
Another commodity-related currency positive against the U.S dollar, AUD/USD rose 0.37% to 0.6769, and NZD/USD gain 0.24% to 0.6397 level.
EUR/USD Intraday: Trend on the upside
Our pivot point is at 1.05500
Preferable Price Action: Take long positions above pivot level with targets at 1.05690 & 1.05820 in extension.
Alternative Price Action: Below pivot looks for a further downside to 1.05310 & 1.05170.
Comment: RSI above 50 levels and Pairs above 20MA & 55MA.
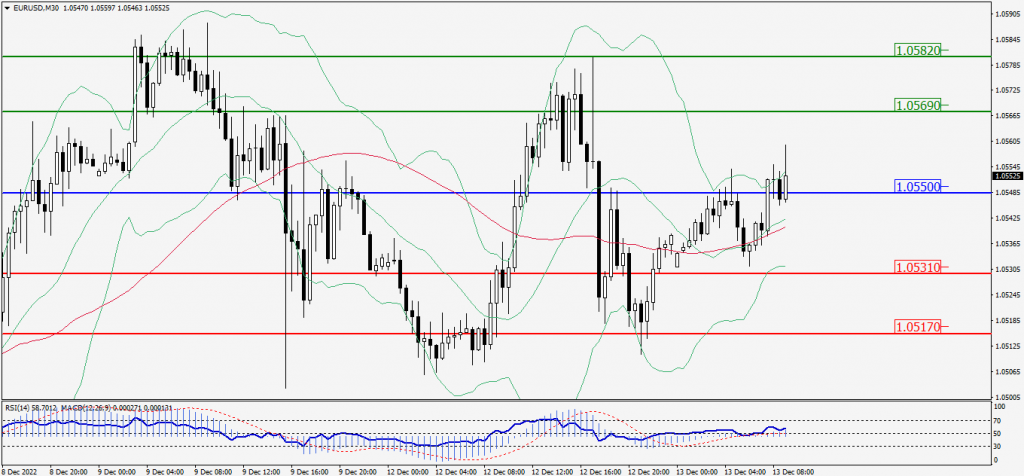
Green Lines Indicate Resistance Levels – Red Lines Indicate Support Levels
Light Blue is a Pivot Point – Black represents the price when the report was produced
GBP/USD Intraday: Support level at 1.22840
Our pivot point is at 1.22840
Preferable Price Action: Buy positions above pivot with targets at 1.23580 & 1.24110 in extension.
Alternative Price Action: The price below pivot would call for further downside to 1.22090 & 1.21550.
Comment: RSI above 50 levels and Pairs above 20MA & 55MA.
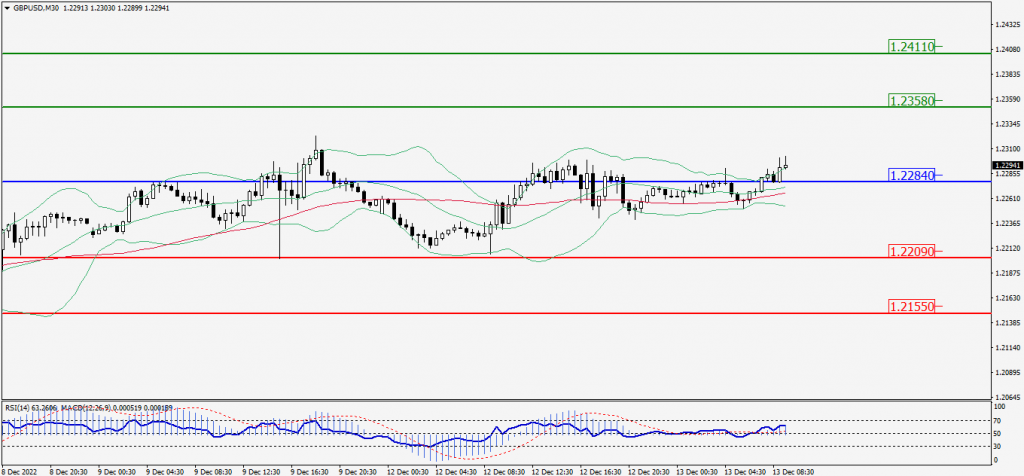
Green Lines Indicate Resistance Levels – Red Lines Indicate Support Levels
Light Blue is a Pivot Point – Black represents the price when the report was produced
USD/JPY Intraday: Trend on the downside
Our pivot point is at 137.640
Preferable Price Action: Sell position below pivot with the target at 136.620 and 135.750 in extension.
Alternative Price Action: The upside breakout of the pivot would call for 138.680 and 139.470.
Comment: MACD is negative territory and Pairs below 20MA.
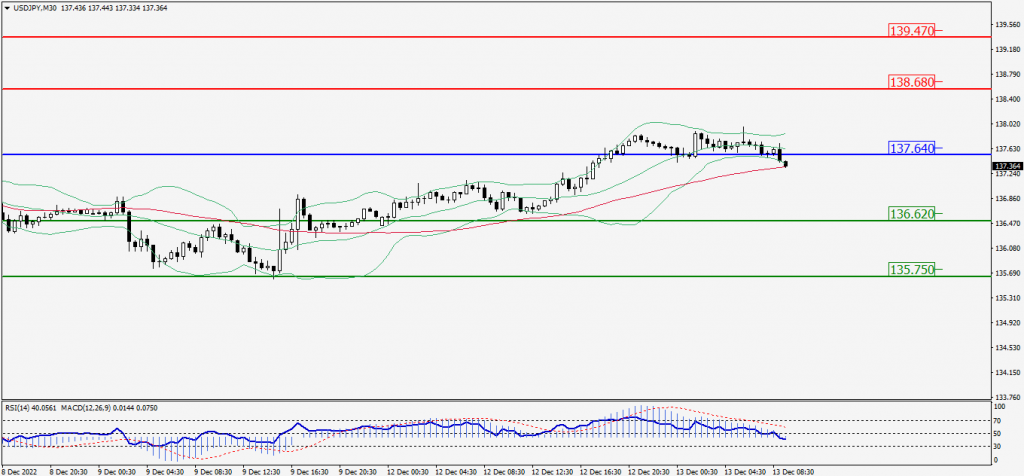
Green Lines Indicate Resistance Levels – Red Lines Indicate Support Levels
Light Blue is a Pivot Point – Black represents the price when the report was produced
AUD/USD Intraday: Major trend on the upside
Our pivot point is at 0.67750
Preferable Price Action: Buy Positions above pivot with targets at 0.67900 & 0.68020 in extension.
Alternative Price Action: Below pivot looks for a further downside with 0.67600 & 0.67480 as targets.
Comment: RSI above 50 levels and Pairs above 20MA & 55MA.
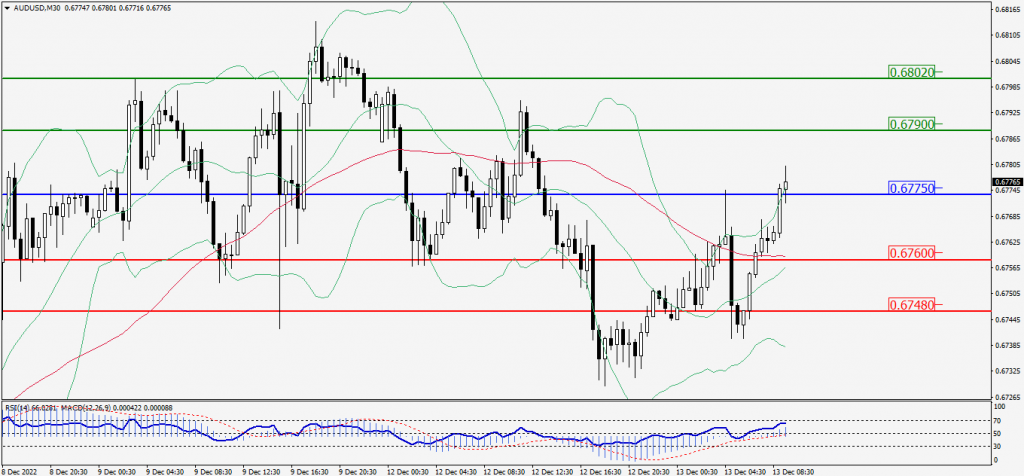
Green Lines Indicate Resistance Levels – Red Lines Indicate Support Levels
Light Blue is a Pivot Point – Black represents the price when the report was produced
CRUDEOIL Intraday: Major trend 0n the upside
Our pivot point is at 74.07
Preferable Price Action: Above pivots buy oil with 75.99 & 77.58 as targets.
Alternative Price Action: Sell crude below pivot with targets at 72.12 and 70.46 in extension.
Comment: MACD is positive territory and Pairs above 20MA & 55MA.
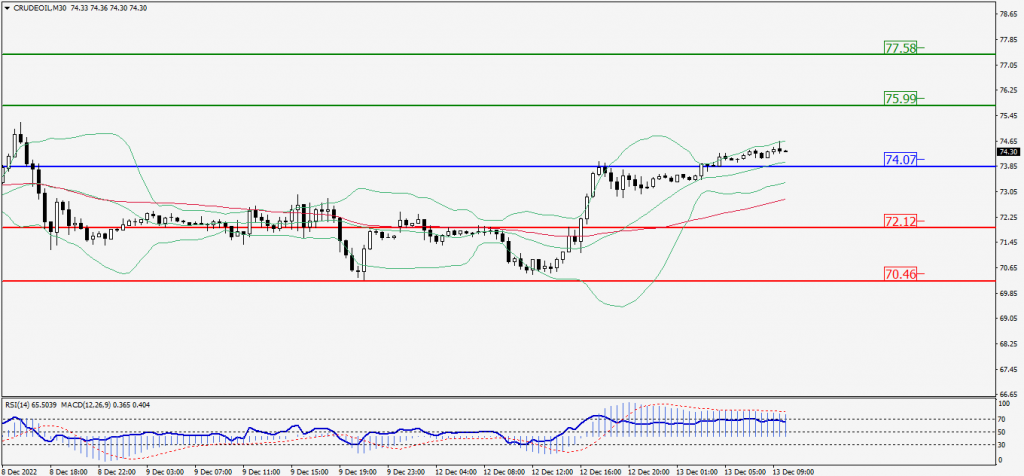
Green Lines Indicate Resistance Levels – Red Lines Indicate Support Levels
Light Blue is a Pivot Point – Black represents the price when the report was produced
XAU/USD Intraday: Trend on the upside
Our pivot point is 1785.40
Preferable Price Action: Further upside to 1793.00 and 1798.60
Alternative Price Action: If the price gives a downside breakout of a pivot, then the price extends to 1778.40 and 1773.40.
Comment: MACD is positive territory and Pairs above 20MA & 55MA.
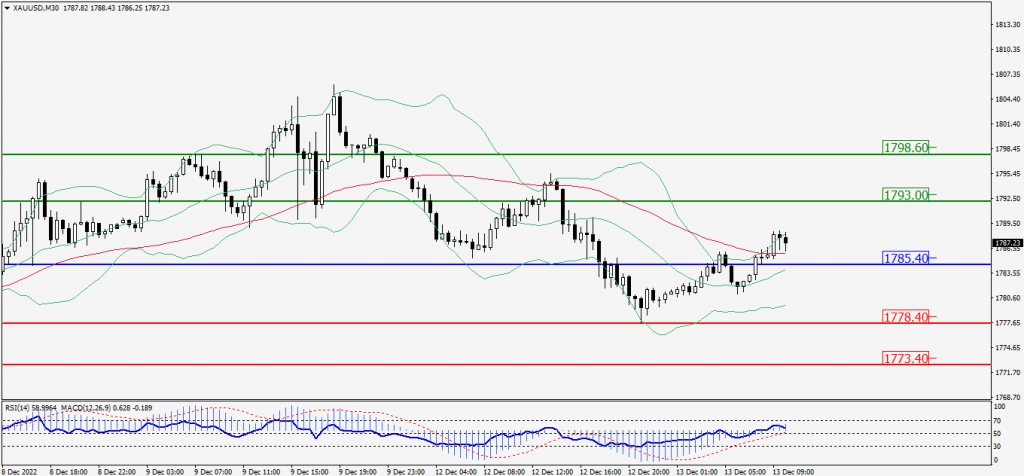
Green Lines Indicate Resistance Levels – Red Lines Indicate Support Levels
Light Blue is a Pivot Point – Black represents the price when the report was produced
Dow Jones Intraday: Major trend on the upside
Our pivot point is 33,959.00
Preferable Price Action: Take buy positions above the pivot with targets at 34,307.00 & 34,570.00.
Alternative Price Action: Below 33,959.00 looks for further downside to 33,623.00 & 33,352.00.
Comment: RSI above 50 levels and Pairs above 55MA.
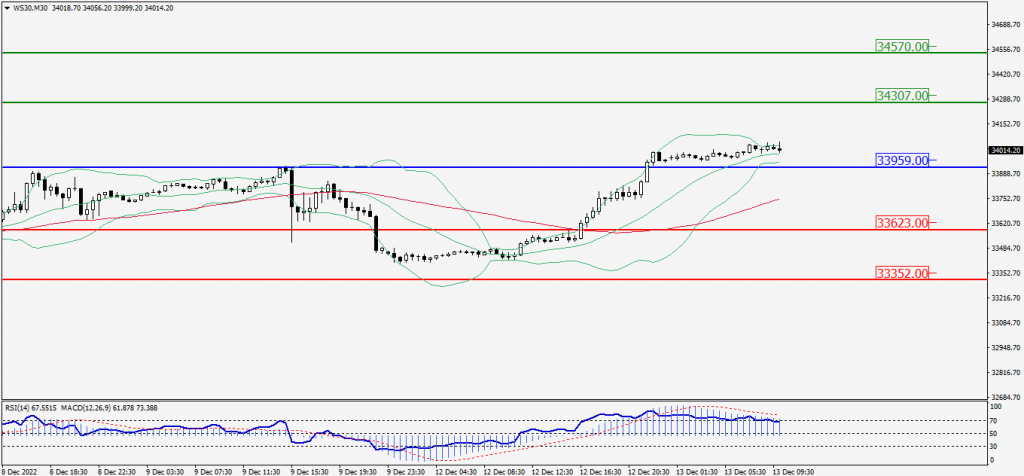
Green Lines Indicate Resistance Levels – Red Lines Indicate Support Levels
Light Blue is a Pivot Point – Black represents the price when the report was produced