Market Wrap: Stocks, Bonds, Commodities
Global shares rose on Friday and the US dollar fell, after jobs data came in stronger than expected but also hinted at some slack in the tight American labour market, raising hopes the Federal Reserve might ease up on monetary tightening.
The Dow Jones Industrial Average rose 401.97 points to 32,403.22, the S&P 500 gain 50.66 points to 3,770.55 and the Nasdaq Composite add 132.31 points to 10,475.25.
MSCI’s index of Asia-Pacific stocks outside Japan is ascend 1.58% to 558.27 levels. Australian index higher 0.60% to 6,933.70. Japanese Nikkei Index ascend 1.21% to 27,527.64.
European stocks were negative on Monday, with the Stoxx Europe 50 Index fell 0.35% to 3,675.25, Germany’s DAX drop 0.25% to 13,422.50, and France’s CAC down 0.65% to 6,374.74, and U.K.’s FTSE 100 slipped 0.22% to 7,318.80.
Benchmark 10-year U.S. Treasury fell as demand for safe assets ascend again, today 10-year bond yields a positive 0.52% to 4.1800.
Oil prices fell more than 2 percent at the start of Asia trade on Monday after Chinese officials on the weekend reiterated their commitment to a strict Covid containment approach, dashing hopes of an oil demand rebound at the world’s top crude importer.
Spot Brent crude oil subtract 1.01% to $97.56 per barrel. US West Texas Intermediate crude is down 1.32% to $91.39 a barrel.
The yellow metal gold is decline 0.20% to 1,673.30 dollars per ounce.
Market Wrap: Forex
The dollar tumbled on Friday after the U.S. nonfarm payrolls report for October showed the world’s largest economy created more new jobs than expected, but also flashed signs of a slowdown with a higher unemployment rate and lower wage inflation.
Today, the U.S. dollar index measures the Greenback against a trade-weighted basket of six major currencies, which is rose 0.14% to 110.930.
The Euro US Dollar (EUR/USD) is a widely traded pair that is down 0.14% today. This left the pair trading around $0.99450.
The Japanese yen was positive against the U.S. dollar on Monday as the stock up. Today USD/JPY is ascend 0.52% to 147.360 level.
Another commodity-related currency negative against the U.S dollar, AUD/USD slipped 0.61% to 0.64260, and NZD/USD down 0.45 to 0.58950 level.
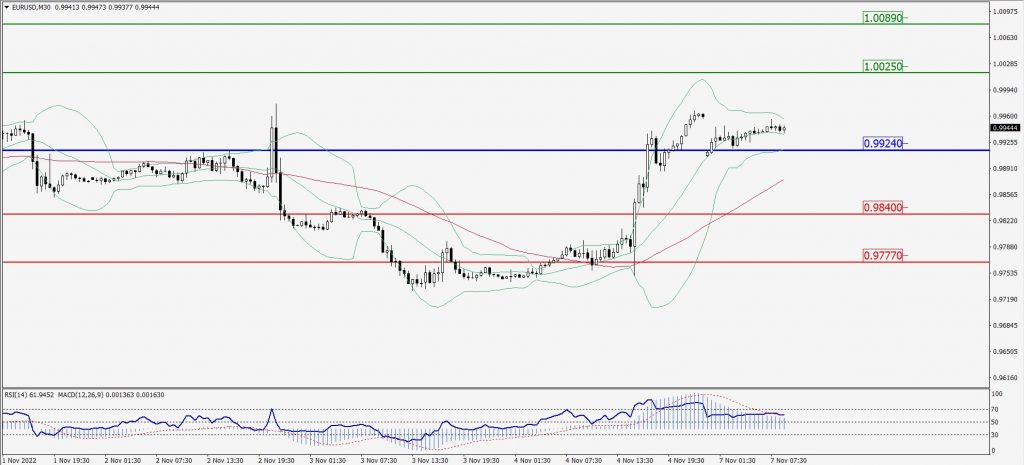
EUR/USD Intraday: Trend on the upside
Our pivot point is at 0.99240
Preferable Price Action: Take buy positions above pivot level with targets at 1.00250 & 1.00890 in extension.
Alternative Price Action: Below pivot looks for a further downside to 0.98400 & 0.97770.
Comment: RSI above 50 levels and Pairs above its 20MA & 55MA.
Green Lines Indicate Resistance Levels – Red Lines Indicate Support Levels
Light Blue is a Pivot Point – Black represents the price when the report was produced
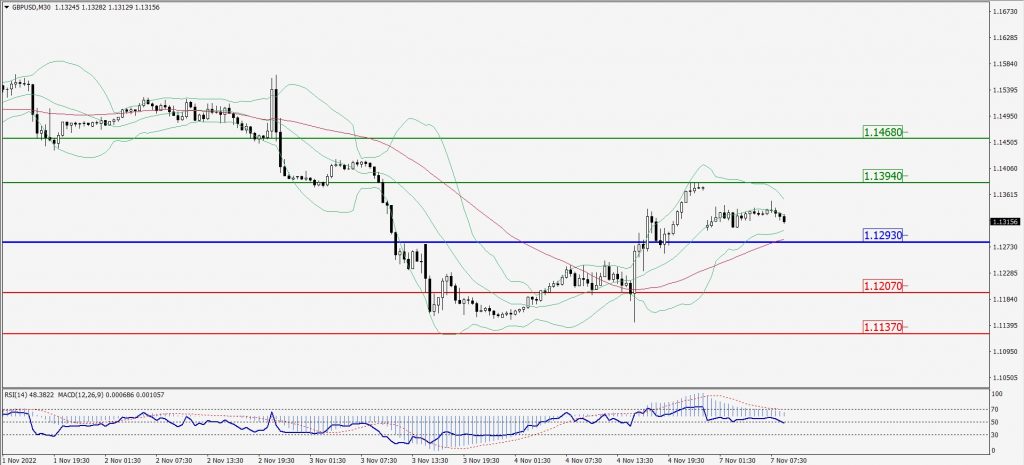
GBP/USD Intraday: In a consolidation zone
Our pivot point is at 1.12930
Preferable Price Action: Buy positions above pivot with targets at 1.13940 & 1.14680 in extension.
Alternative Price Action: The price below pivot would call for further downside to 1.12070 & 1.11370.
Comment: RSI at 50 levels and Pairs above 55MA.
Green Lines Indicate Resistance Levels – Red Lines Indicate Support Levels
Light Blue is a Pivot Point – Black represents the price when the report was produced
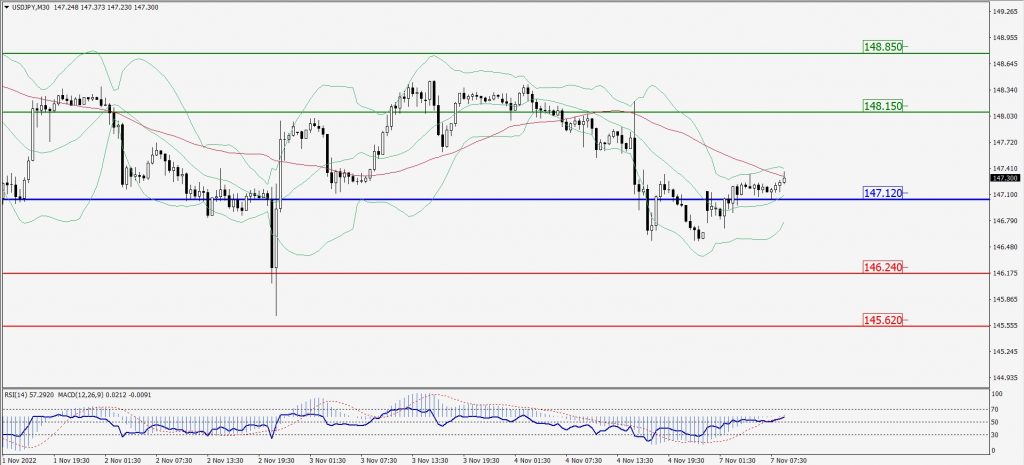
USD/JPY Intraday: Support level at 147.120
Our pivot point is at 147.120
Preferable Price Action: Buy position above pivot with the target at 148.150 and 148.850 in extension.
Alternative Price Action: The downside breakout of the pivot would call for 146.240 and 145.620.
Comment: MACD is positive territory and Pairs above 20MA.
Green Lines Indicate Resistance Levels – Red Lines Indicate Support Levels
Light Blue is a Pivot Point – Black represents the price when the report was produced
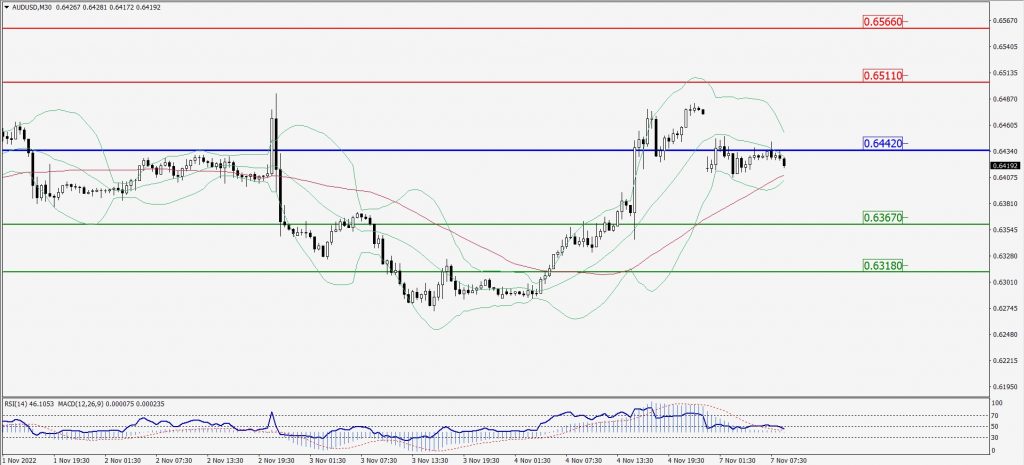
AUD/USD Intraday: Resistance level at 0.64420
Our pivot point is at 0.64420
Preferable Price Action: Sell Positions below pivot with targets at 0.63670 & 0.63180 in extension.
Alternative Price Action: Above pivot looks for a further upside with 0.65110 & 0.65660 as targets.
Comment: RSI below 50 levels and Pairs below 20MA.
Green Lines Indicate Resistance Levels – Red Lines Indicate Support Levels
Light Blue is a Pivot Point – Black represents the price when the report was produced
CRUDEOIL Intraday: Trend on the downside
Our pivot point is at 91.19
Preferable Price Action: Below pivots sell oil with 89.54 & 88.44 as targets.
Alternative Price Action: Buy crude above pivot with targets at 92.67 and 93.72 in extension.
Comment: MACD is in the negative territory and Pairs below 20MA.
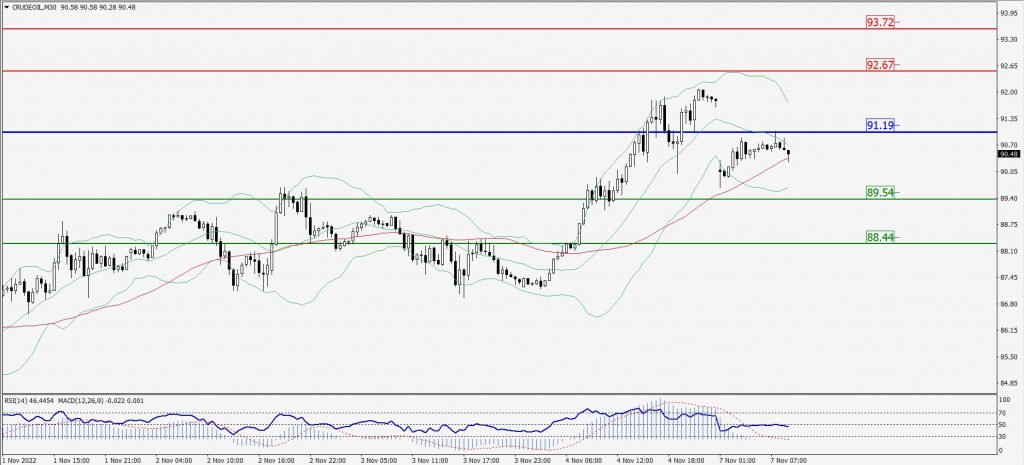
Green Lines Indicate Resistance Levels – Red Lines Indicate Support Levels
Light Blue is a Pivot Point – Black represents the price when the report was produced
XAU/USD Intraday: Resistance level at 1678.40
Our pivot point is 1678.40
Preferable Price Action: Further downside to 1657.70 and 1643.40
Alternative Price Action: If the price gives an upside breakout of a pivot, then the price extends to 1695.10 and 1708.00.
Comment: MACD is negative territory and Pairs below 20MA.
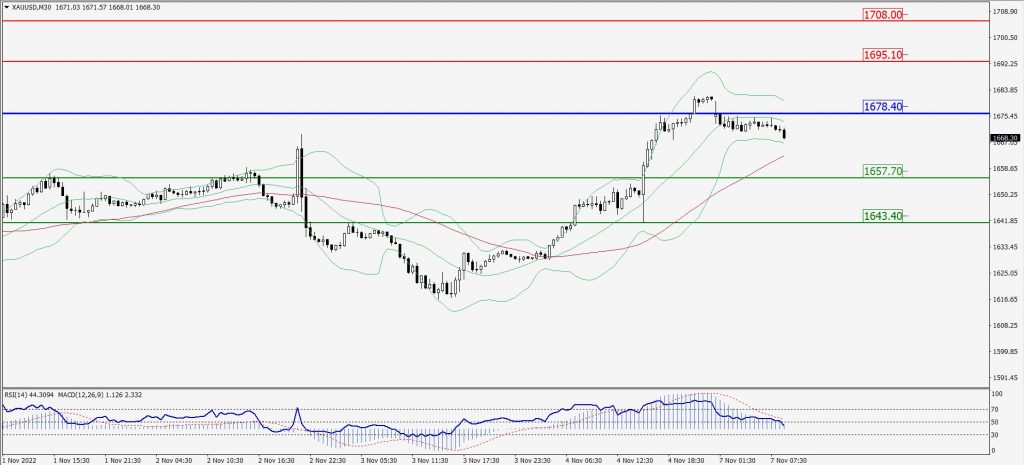
Green Lines Indicate Resistance Levels – Red Lines Indicate Support Levels
Light Blue is a Pivot Point – Black represents the price when the report was produced
Dow Jones Intraday: Trend on the upside
Our pivot point is 32,268.00
Preferable Price Action: Take buy positions above pivot with targets at 32,579.00 & 32,807.00.
Alternative Price Action: Below 32,268.00 looks for further downside to 31,987.00 & 31,751.00.
Comment: RSI above 50 levels and Pairs above 55MA.
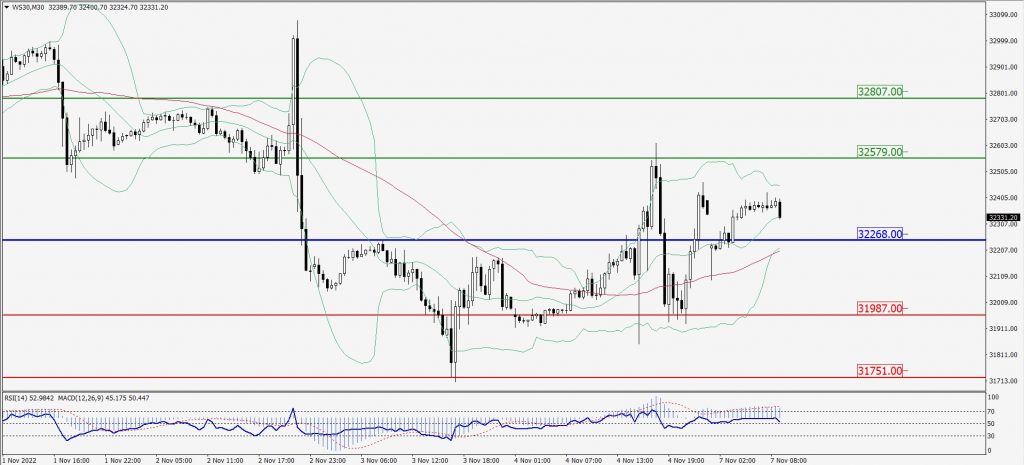
Green Lines Indicate Resistance Levels – Red Lines Indicate Support Levels
Light Blue is a Pivot Point – Black represents the price when the report was produced