Market Wrap: Stocks, Bonds, Commodities
Wall Street closed lower on Wednesday, marking the end of a multi-session rally, and Treasury yields spiked as gloomy data and downbeat corporate outlooks tossed cold water on investor risk appetite.
The Dow Jones Industrial Average fell 99.99 points to 30,423.81, the S&P 500 lose 24.82 points to 3,695.16 and the Nasdaq Composite subtract 91.89 points to 10,680.51.
MSCI’s index of Asia-Pacific stocks outside Japan is drop 0.81% to 538.24 levels. Australian index higher 1.02% to 6,730.70. Japanese Nikkei Index drop 0.92% to 27,006.96.
European stocks were mixed on Thursday, with the Stoxx Europe 50 Index fell 0.22% to 3,463.75, Germany’s DAX drop 0.47% to 12,681.96, and France’s CAC up 0.17% to 6,050.87, and U.K.’s FTSE 100 surgged 0.05% to 6,926.65.
Benchmark 10-year U.S. Treasury fell as demand for safe assets ascend again, today 10-year bond yields a positive 0.93% to 4.1670.
Oil prices opened mixed in early Asian trade on Thursday as investors balanced caution over tightening supply against lower demand projections.
Spot Brent crude oil add 0.69% to $93.02 per barrel. US West Texas Intermediate crude is up 0.99% to $85.39 a barrel.
The yellow metal gold is decline 0.02% to 1,634.20 dollars per ounce.
Market Wrap: Forex
The U.S. dollar handed back some of its gains in early European trading Wednesday, while the euro rose on the back of soaring German producer prices.
Today, the U.S. dollar index measures the Greenback against a trade-weighted basket of six major currencies, which is fell 0.06% to 112.800.
The Euro US Dollar (EUR/USD) is a widely traded pair that is up 0.12% today. This left the pair trading around $0.97830.
The Japanese yen was positive against the U.S. dollar on Thursday as the stock up. Today USD/JPY is ascend 0.04% to 149.940 level.
Another commodity-related currency mixed against the U.S dollar, AUD/USD surged 0.03% to 0.62720, and NZD/USD down 0.17 to 0.56580 level.
EUR/USD Intraday: Trend on the upside
Our pivot point is at 0.97700
Preferable Price Action: Take buy positions above pivot level with targets at 0.98250 & 0.98560 in extension.
Alternative Price Action: Below pivot looks for a further downside to 0.97290 & 0.97000.
Comment: RSI above 50 levels and Pairs above 20MA.
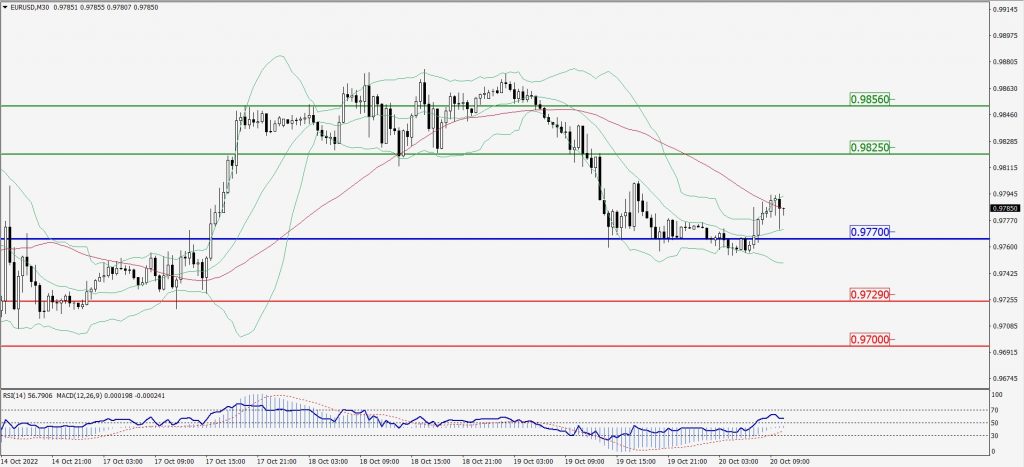
Green Lines Indicate Resistance Levels – Red Lines Indicate Support Levels
Light Blue is a Pivot Point – Black represents the price when the report was produced
GBP/USD Intraday: In a consolidation zone
Our pivot point is at 1.12020
Preferable Price Action: Buy positions above pivot with targets at 1.12700 & 1.13220 in extension.
Alternative Price Action: The price below pivot would call for further downside to 1.11450 & 1.10960.
Comment: RSI at 50 levels and Pairs above 20MA.
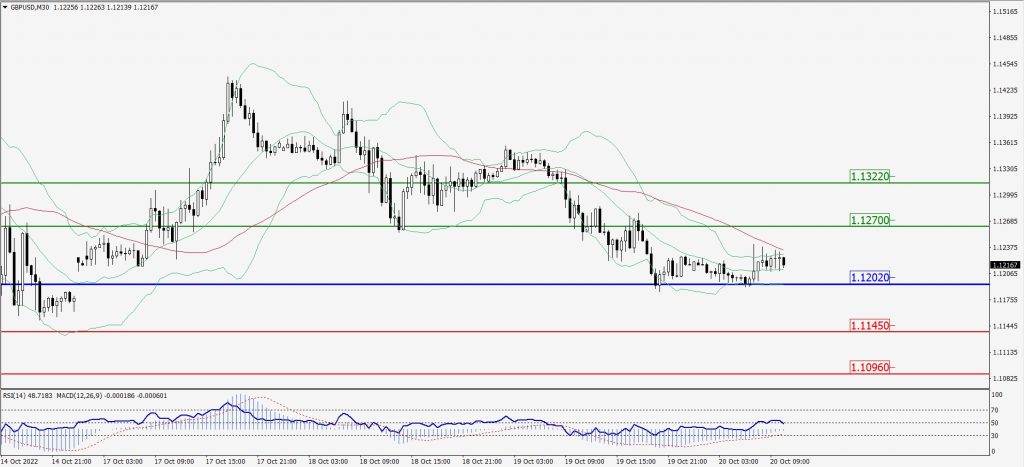
Green Lines Indicate Resistance Levels – Red Lines Indicate Support Levels
Light Blue is a Pivot Point – Black represents the price when the report was produced
USD/JPY Intraday: Major trend on the upside
Our pivot point is at 149.890
Preferable Price Action: Buy position above pivot with the target at 150.690 and 151.250 in extension.
Alternative Price Action: The downside breakout of the pivot would call for 149.120 and 148.540.
Comment: MACD is positive territory and Pairs above its 20MA & 55MA.
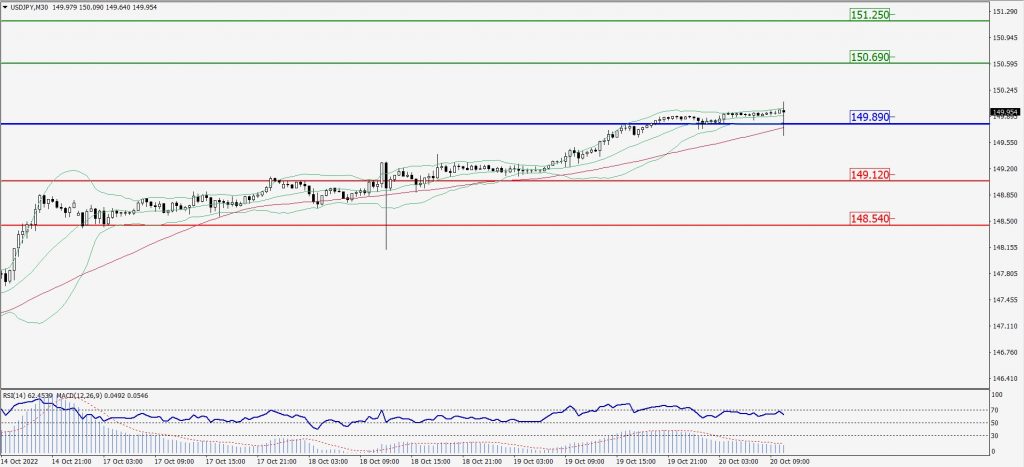
Green Lines Indicate Resistance Levels – Red Lines Indicate Support Levels
Light Blue is a Pivot Point – Black represents the price when the report was produced
AUD/USD Intraday: Support level at 0.62630
Our pivot point is at 0.62630
Preferable Price Action: Buy Positions above pivot with targets at 0.63000 & 0.63240 in extension.
Alternative Price Action: Below pivot looks for a further downside with 0.62300 & 0.62050 as targets.
Comment: RSI above 50 levels and Pairs above 20MA.
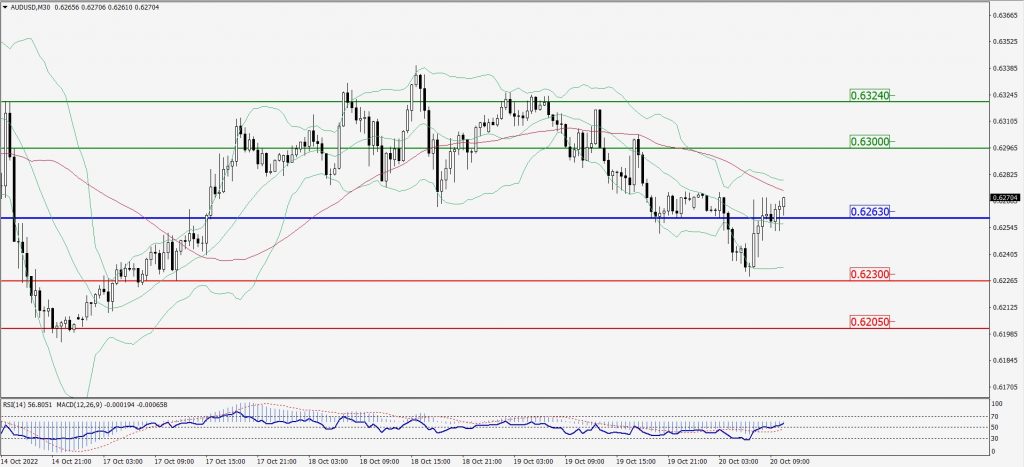
Green Lines Indicate Resistance Levels – Red Lines Indicate Support Levels
Light Blue is a Pivot Point – Black represents the price when the report was produced
CRUDEOIL Intraday: Support level at 85.44
Our pivot point is at 85.44
Preferable Price Action: Above pivots buy oil with 87.42 & 88.72 as targets.
Alternative Price Action: Sell crude below pivot with targets at 83.84 and 82.74 in extension.
Comment: MACD is in the positive territory and Pairs above its 20MA & 55MA.
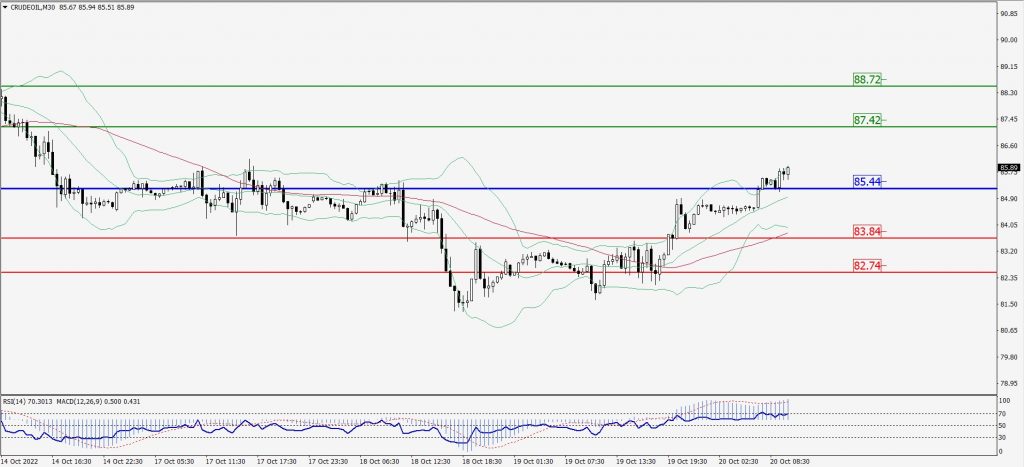
Green Lines Indicate Resistance Levels – Red Lines Indicate Support Levels
Light Blue is a Pivot Point – Black represents the price when the report was produced
XAU/USD Intraday: Trend on the upside
Our pivot point is 1630.80
Preferable Price Action: Further upside to 1641.50 and 1649.40
Alternative Price Action: If the price gives a downside breakout of a pivot, then the price extends to 1622.90 and 1615.40.
Comment: MACD is positive territory and Pairs above 20MA.
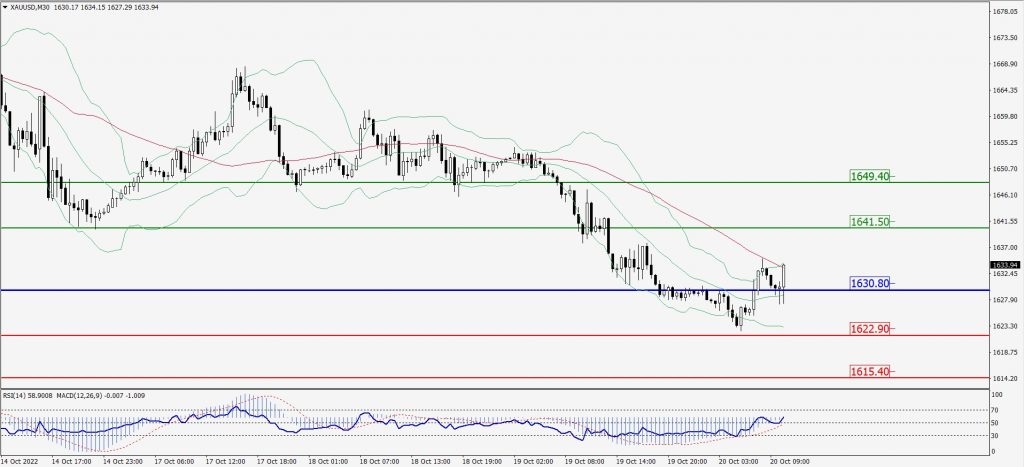
Green Lines Indicate Resistance Levels – Red Lines Indicate Support Levels
Light Blue is a Pivot Point – Black represents the price when the report was produced
Dow Jones Intraday: Resistance level at 30,487.00
Our pivot point is 30,487.00
Preferable Price Action: Take sell positions below pivot with targets at 30,133.00 & 29,887.00.
Alternative Price Action: Above 30,487.00 looks for further upside to 30,822.00 & 31,045.00.
Comment: RSI below 50 levels and Pairs below its 20MA & 55MA.
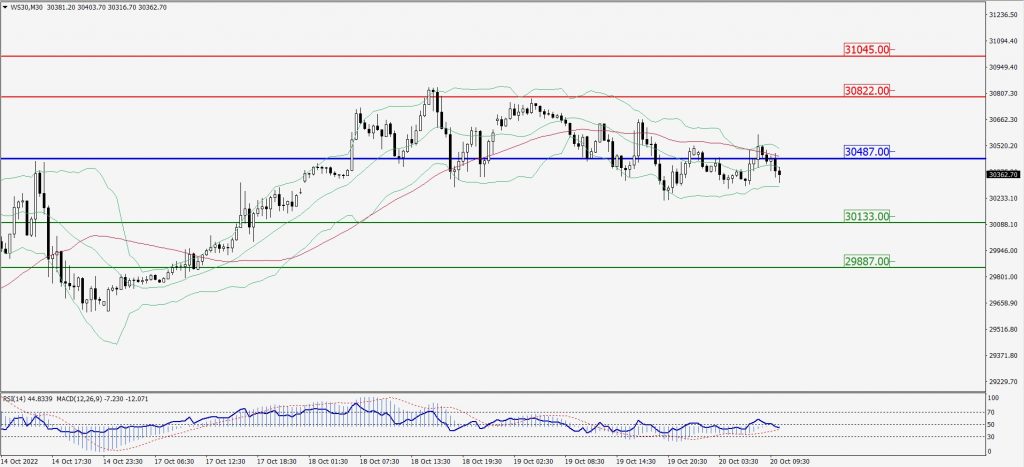
Green Lines Indicate Resistance Levels – Red Lines Indicate Support Levels
Light Blue is a Pivot Point – Black represents the price when the report was produced