Market Wrap: Stocks, Bonds, Commodities
Wall Street ended sharply lower on Thursday on worries that the US Federal Reserve’s aggressive fight against inflation could hobble the US economy, and as investors fretted about a rout in global currency and debt markets.
The Dow Jones Industrial Average fell 458.13 points to 29,225.61, the S&P 500 lose 78.57 points to 3,640.47 and the Nasdaq Composite subtract 314.13 points to 10,737.51.
MSCI’s index of Asia-Pacific stocks outside Japan is ascend 0.27% to 648.11 levels. Australian index lower 1.23% to 6,474.00. Japanese Nikkei Index drop 1.83% to 25,937.21.
European stocks were positive on Friday, with the Stoxx Europe 50 Index rose 1.04% to 3,313.05, Germany’s DAX ascend 1.09% to 12,107.61, and France’s CAC up 1.13% to 5,741.04, and U.K.’s FTSE 100 surge 0.73% to 6,932.30.
Benchmark 10-year U.S. Treasury fell as demand for safe assets ascend again, today 10-year bond yields a negative 0.88% to 3.7140.
Oil prices were little changed in early trade on Friday but headed for their first weekly gain in five weeks, underpinned by a weaker US dollar and the possibility that OPEC+ may agree to cut crude output when it meets on October 5.
Spot Brent crude oil add 1.27% to $88.27 per barrel. US West Texas Intermediate crude is up 1.12% to $82.12 a barrel.
The yellow metal gold is advance 0.70% to 1,680.55 dollars per ounce.
Market Wrap: Forex
The U.S. dollar edged lower in early European trading Friday as sterling and the euro stabilized near one-week highs, helped by intervention by the Bank of England and the expectation of aggressive tightening by the European Central Bank.
Today, the U.S. dollar index measures the Greenback against a trade-weighted basket of six major currencies, which is fell 0.49% to 111.640.
The Euro US Dollar (EUR/USD) is a widely traded pair that is up 0.30% today. This left the pair trading around $0.98420.
The Japanese yen was positive against the U.S. dollar on Friday as the stock up. Today USD/JPY is drop 0.14% to 144.250 level.
Another commodity-related currency positive against the U.S dollar, AUD/USD surge 0.19% to 0.65100, and NZD/USD add 1.12 to 0.57280 level.
EUR/USD Intraday: In a consolidation zone
Our pivot point is at 0.98050
Preferable Price Action: Take buy positions above pivot level with targets at 0.99000 & 0.99710 in extension.
Alternative Price Action: Below pivot looks for a further downside to 0.97150 & 0.96480.
Comment: RSI at 50 levels and Pairs above 55MA.
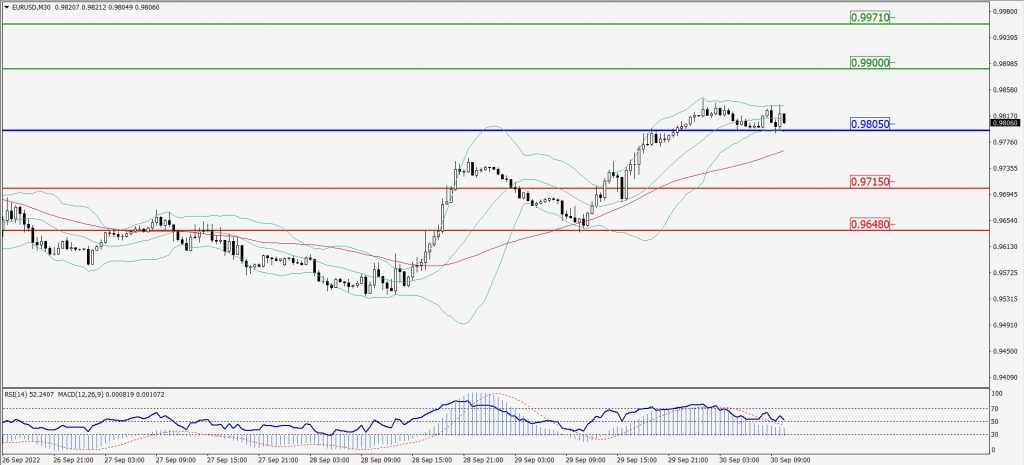
Green Lines Indicate Resistance Levels – Red Lines Indicate Support Levels
Light Blue is a Pivot Point – Black represents the price when the report was produced
GBP/USD Intraday: Trend on the upside
Our pivot point is at 1.10880
Preferable Price Action: Buy positions above pivot with targets at 1.12750 & 1.14140 in extension.
Alternative Price Action: The price below pivot would call for further downside to 1.09240 & 1.08090.
Comment: RSI above 50 levels and Pairs above its 20MA & 55MA.
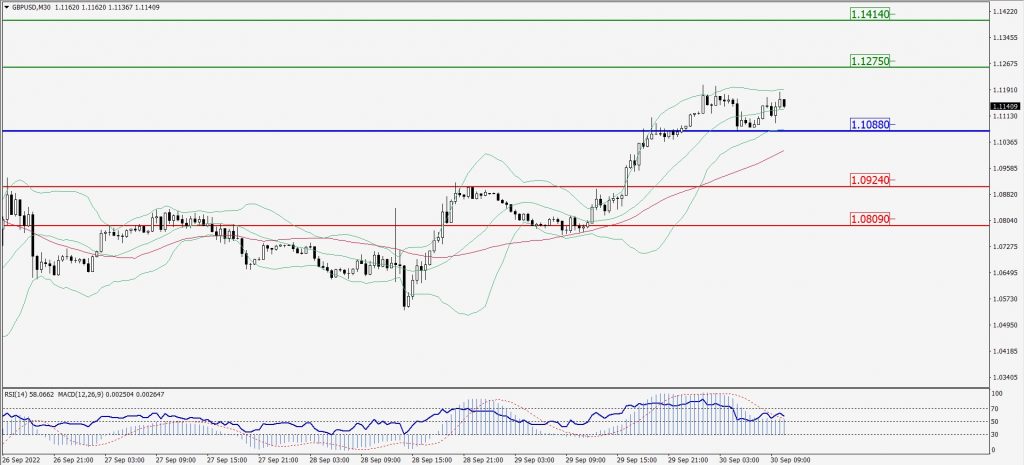
Green Lines Indicate Resistance Levels – Red Lines Indicate Support Levels
Light Blue is a Pivot Point – Black represents the price when the report was produced
USD/JPY Intraday: Trend on the downside
Our pivot point is at 144.580
Preferable Price Action: Sell position below pivot with the target at 144.220 and 143.960 in extension.
Alternative Price Action: The upside breakout of the pivot would call for 144.860 and 145.120.
Comment: MACD is negative territory and Pairs below its 20MA & 55MA.
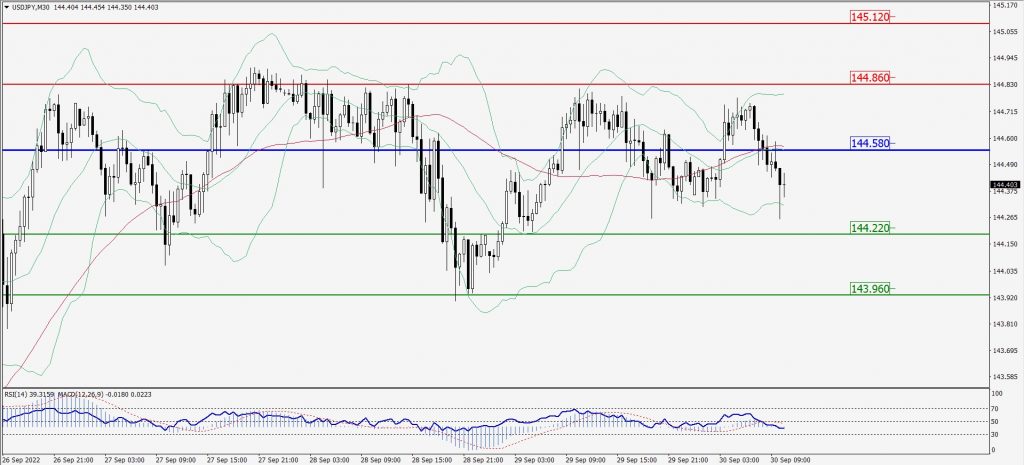
Green Lines Indicate Resistance Levels – Red Lines Indicate Support Levels
Light Blue is a Pivot Point – Black represents the price when the report was produced
AUD/USD Intraday: Support level at 0.64810
Our pivot point is at 0.64810
Preferable Price Action: Buy Positions above pivot with targets at 0.65320 & 0.65700 in extension.
Alternative Price Action: Below pivot looks for a further downside with 0.64390 & 0.64060 as targets.
Comment: RSI above 50 levels and Pairs above its 20MA & 55MA.
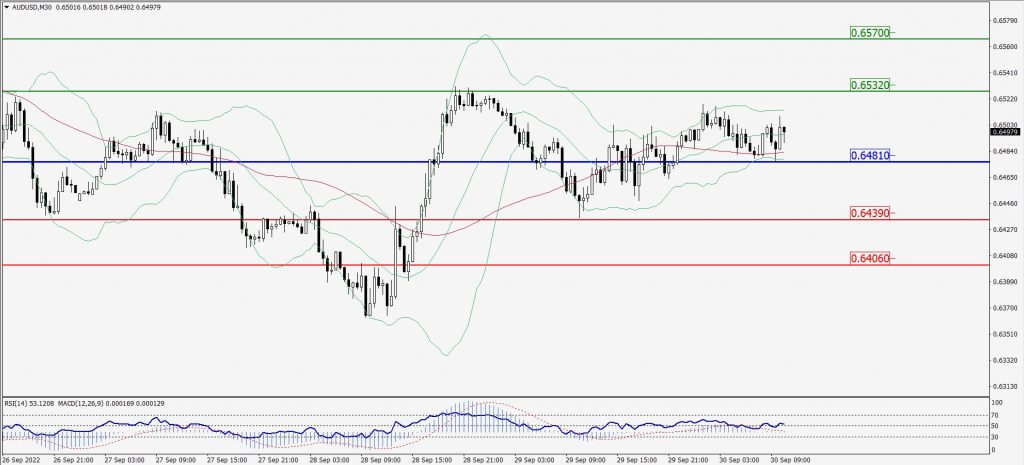
Green Lines Indicate Resistance Levels – Red Lines Indicate Support Levels
Light Blue is a Pivot Point – Black represents the price when the report was produced
CRUDEOIL Intraday: Support level at 80.95
Our pivot point is at 80.95
Preferable Price Action: Above pivots buy oil with 83.13 & 84.55 as targets.
Alternative Price Action: Sell crude below pivot with targets at 79.34 and 77.92 in extension.
Comment: MACD is in the positive territory and Pairs above its 20MA & 55MA.
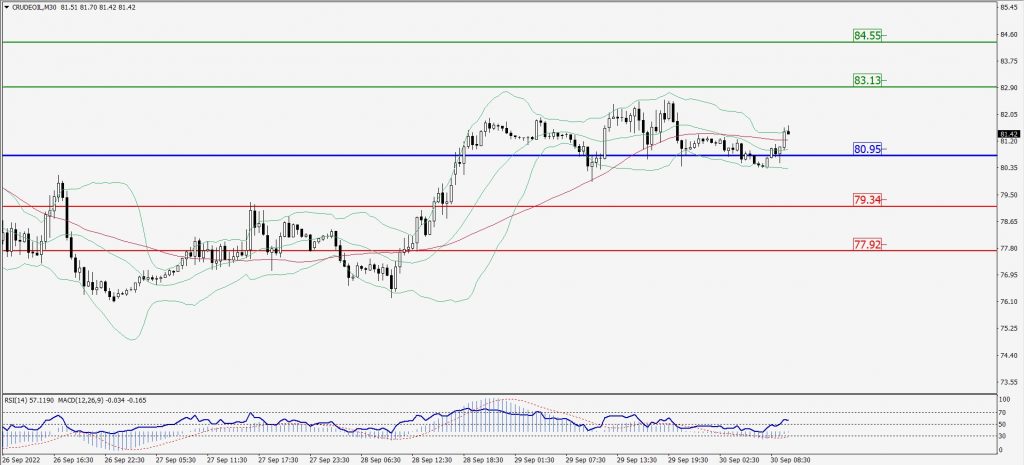
Green Lines Indicate Resistance Levels – Red Lines Indicate Support Levels
Light Blue is a Pivot Point – Black represents the price when the report was produced
XAU/USD Intraday: Major trend on the upside
Our pivot point is 1665.80
Preferable Price Action: Further upside to 1683.30 and 1696.50
Alternative Price Action: If the price gives a downside breakout of a pivot, then the price extends to 1651.40 and 1639.10.
Comment: MACD is positive territory and Pairs above its 20MA & 55MA.
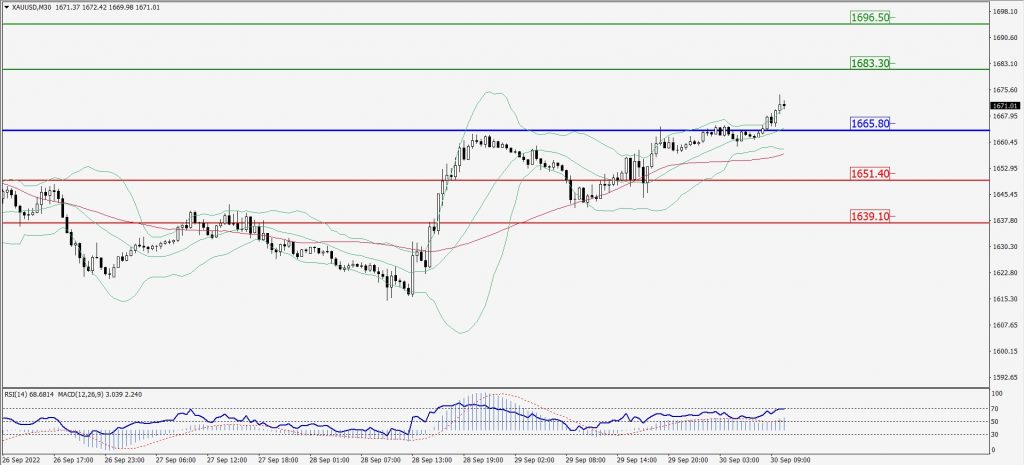
Green Lines Indicate Resistance Levels – Red Lines Indicate Support Levels
Light Blue is a Pivot Point – Black represents the price when the report was produced
Dow Jones Intraday: Trend on the upside
Our pivot point is 29,293.00
Preferable Price Action: Take buy positions above pivot with targets at 29,561.00 & 29,733.00.
Alternative Price Action: Below 29,293.00 looks for further downside to 29,080.00 & 28,887.00.
Comment: RSI above 50 levels and Pairs above its 20MA & 55MA.
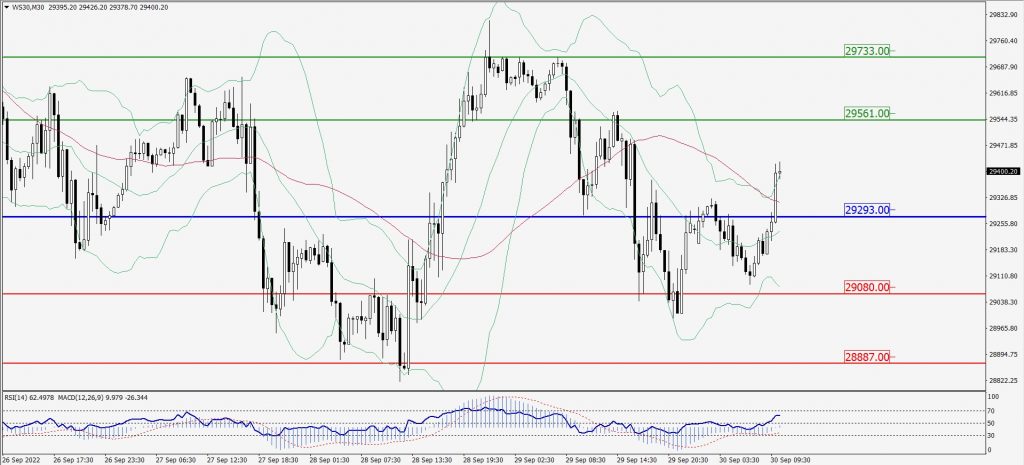
Green Lines Indicate Resistance Levels – Red Lines Indicate Support Levels
Light Blue is a Pivot Point – Black represents the price when the report was produced