Market Wrap: Stocks, Bonds, Commodities
Global equities staged a partial comeback on Wednesday — with Wall Street stocks surging around 2% — as the Bank of England said it would step in to the bond market in an attempt to dampen investors’ fears of contagion across the financial system.
The Dow Jones Industrial Average rose 548.75 points to 29,683.74, the S&P 500 gain 71.75 points to 3,719.04 and the Nasdaq Composite add 222.13 points to 11,051.64.
MSCI’s index of Asia-Pacific stocks outside Japan is drop 0.37% to 656.13 levels. Australian index higher 1.44% to 6,555.00. Japanese Nikkei Index ascend 0.95% to 26,422.05.
European stocks were negative on Thursday, with the Stoxx Europe 50 Index fell 1.30% to 3,292.15, Germany’s DAX drop 1.31% to 12,032.16, and France’s CAC down 1.24% to 5,693.41, and U.K.’s FTSE 100 slipped 1.78% to 6,877.10.
Benchmark 10-year U.S. Treasury fell as demand for safe assets ascend again, today 10-year bond yields a positive 3.48% to 3.8360.
Oil prices jumped higher on Wednesday for a second day, rebounding from recent losses as the US dollar eased off recent gains and US fuel inventory figures showed larger-than-expected drawdowns and a rebound in consumer demand.
Spot Brent crude oil subtract 1.19% to $87.00 per barrel. US West Texas Intermediate crude is down 1.19% to $81.13 a barrel.
The yellow metal gold is decline 0.92% to 1,654.60 dollars per ounce.
Market Wrap: Forex
The U.S. dollar resumed its seemingly relentless march higher in early European trading Thursday, while sterling slumped as the relief rally attached to the Bank of England’s intervention into the bond market dissipated.
Today, the U.S. dollar index measures the Greenback against a trade-weighted basket of six major currencies, which is rose 0.89% to 113.520.
The Euro US Dollar (EUR/USD) is a widely traded pair that is down 0.75% today. This left the pair trading around $0.96610.
The Japanese yen was positive against the U.S. dollar on Thursday as the stock up. Today USD/JPY is ascend 0.34% to 144.630 level.
Another commodity-related currency negative against the U.S dollar, AUD/USD slipped 1.07% to 0.64530, and NZD/USD subtract 1.12 to 0.56640 level.
EUR/USD Intraday: Trend on the downside
Our pivot point is at 0.96890
Preferable Price Action: Take sell positions below pivot level with targets at 0.95950 & 0.95380 in extension.
Alternative Price Action: Above pivot looks for a further upside to 0.97740 & 0.98330.
Comment: RSI below 50 levels and Pairs below 20MA.
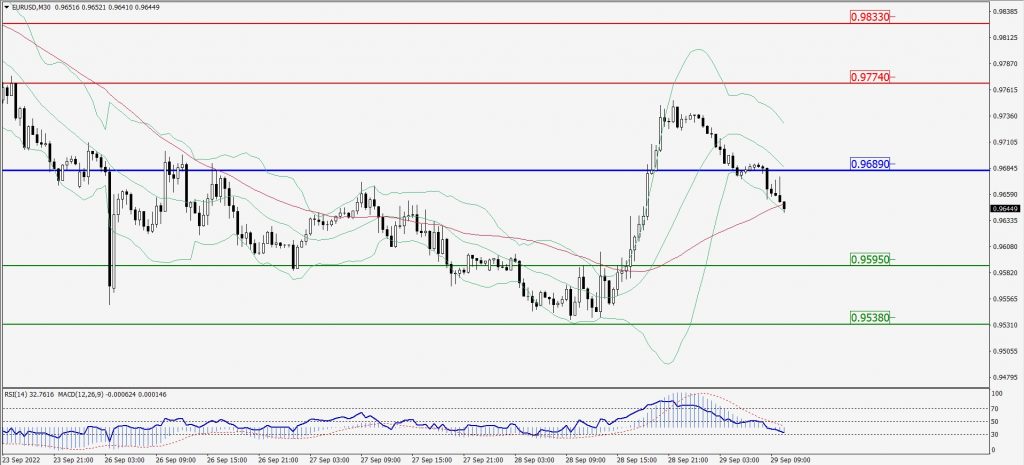
Green Lines Indicate Resistance Levels – Red Lines Indicate Support Levels
Light Blue is a Pivot Point – Black represents the price when the report was produced
GBP/USD Intraday: In a consolidation zone
Our pivot point is at 1.09250
Preferable Price Action: Sell positions below pivot with targets at 1.06200 & 1.04270 in extension.
Alternative Price Action: The price above pivot would call for further upside to 1.11880 & 1.13840.
Comment: RSI at 50 levels and Pairs below 20MA.
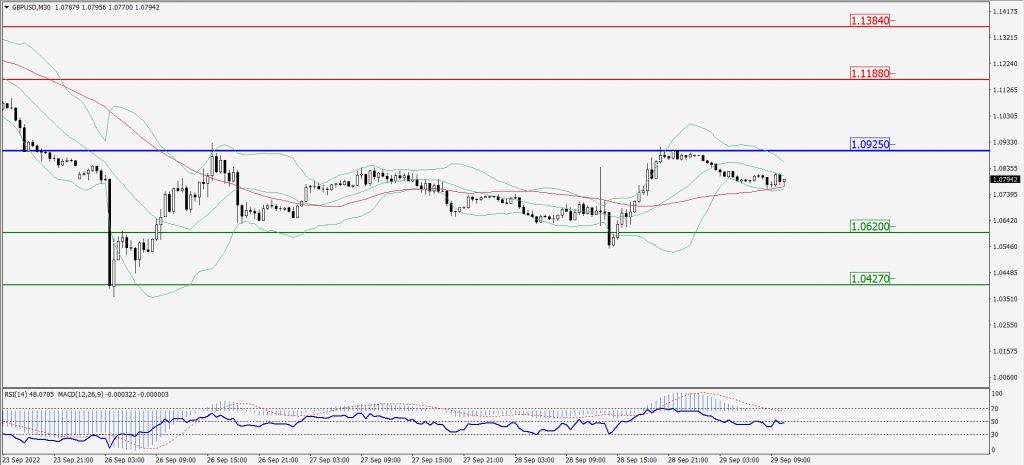
Green Lines Indicate Resistance Levels – Red Lines Indicate Support Levels
Light Blue is a Pivot Point – Black represents the price when the report was produced
USD/JPY Intraday: Trend on the upside
Our pivot point is at 144.510
Preferable Price Action: Buy position above pivot with the target at 145.280 and 145.840 in extension.
Alternative Price Action: The downside breakout of the pivot would call for 143.820 and 143.290.
Comment: MACD is positive territory and Pairs above its 20MA & 55MA.
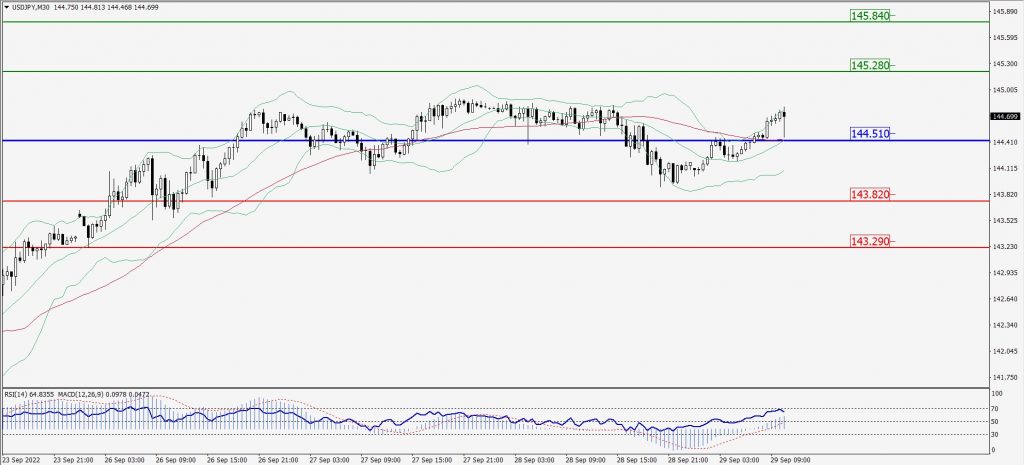
Green Lines Indicate Resistance Levels – Red Lines Indicate Support Levels
Light Blue is a Pivot Point – Black represents the price when the report was produced
AUD/USD Intraday: Trend on the downside
Our pivot point is at 0.64740
Preferable Price Action: Sell Positions below pivot with targets at 0.64090 & 0.63650 in extension.
Alternative Price Action: Above pivot looks for a further upside with 0.65280 & 0.65720 as targets.
Comment: RSI below 50 levels and Pairs below its 20MA & 55MA.
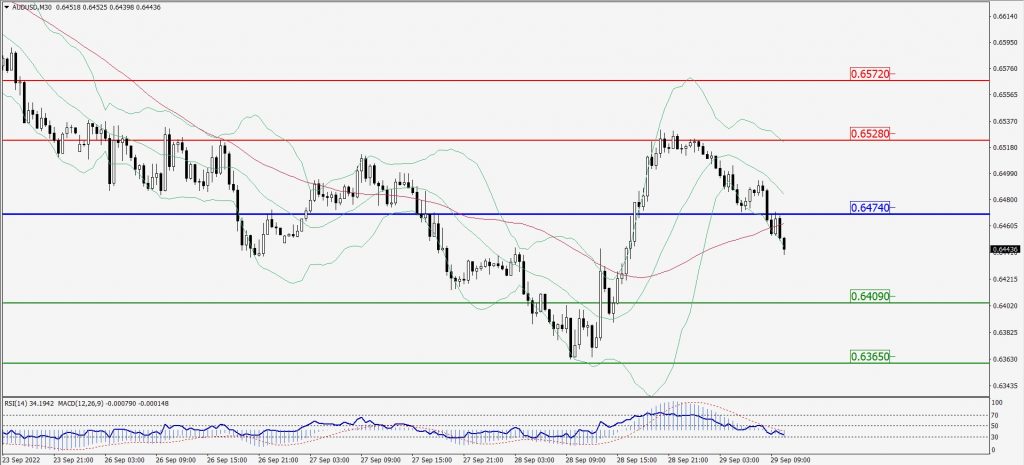
Green Lines Indicate Resistance Levels – Red Lines Indicate Support Levels
Light Blue is a Pivot Point – Black represents the price when the report was produced
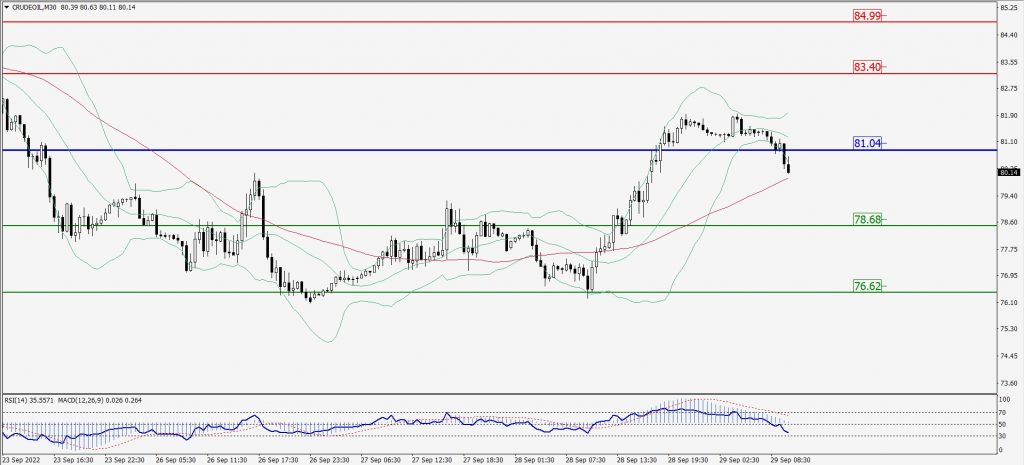
CRUDEOIL Intraday: Resistance level at 81.04
Our pivot point is at 81.04
Preferable Price Action: Below pivots sell oil with 78.68 & 76.62 as targets.
Alternative Price Action: Buy crude above pivot with targets at 83.40 and 84.99 in extension.
Comment: MACD is in the negative territory and Pairs below 20MA.
Green Lines Indicate Resistance Levels – Red Lines Indicate Support Levels
Light Blue is a Pivot Point – Black represents the price when the report was produced
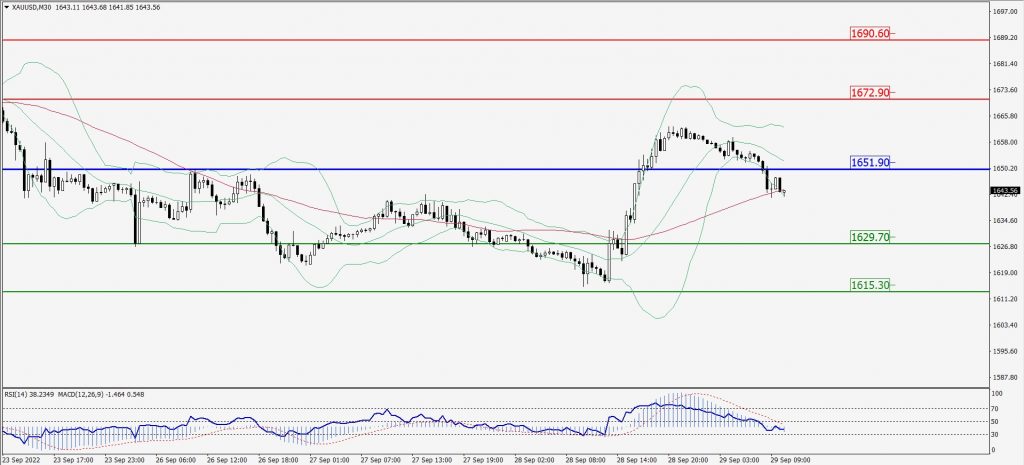
XAU/USD Intraday: Trend on the downside
Our pivot point is 1651.90
Preferable Price Action: Further downside to 1629.70 and 1615.30
Alternative Price Action: If the price gives an upside breakout of a pivot, then the price extends to 1672.90 and 1690.60.
Comment: MACD is negative territory and Pairs below 20MA.
Green Lines Indicate Resistance Levels – Red Lines Indicate Support Levels
Light Blue is a Pivot Point – Black represents the price when the report was produced
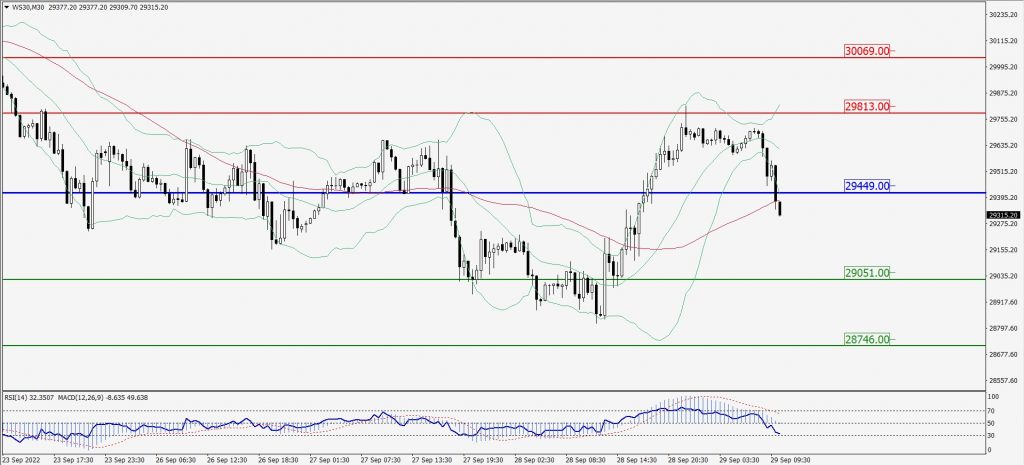
Dow Jones Intraday: Trend on the downside
Our pivot point is 29,449.00
Preferable Price Action: Take sell positions below pivot with targets at 29,051.00 & 28,746.00.
Alternative Price Action: Above 29,449.00 looks for further upside to 29,813.00 & 30,069.00.
Comment: RSI below 50 levels and Pairs below its 20MA & 55MA.
Green Lines Indicate Resistance Levels – Red Lines Indicate Support Levels
Light Blue is a Pivot Point – Black represents the price when the report was produced