Market Wrap: Stocks, Bonds, Commodities
The S&P 500 fell to its lowest level in almost two years on Tuesday on worries about super aggressive Federal Reserve policy tightening, trading under its June trough and leaving investors appraising how much further stocks would have to fall before stabilizing.
The Dow Jones Industrial Average fell 125.82 points to 29,134.99, the S&P 500 lose 7.75 points to 3,647.29 and the Nasdaq Composite add 26.58 points to 10,829.50.
MSCI’s index of Asia-Pacific stocks outside Japan is drop 2.46% to 658.19 levels. Australian index lower 0.53% to 6,462.00. Japanese Nikkei Index drop 1.50% to 26,173.98.
European stocks were negative on Wednesday, with the Stoxx Europe 50 Index fell 1.02% to 3,294.35, Germany’s DAX drop 1.15% to 12,004.43, and France’s CAC down 0.81% to 5,707.21, and U.K.’s FTSE 100 slipped 1.21% to 6,899.20.
Benchmark 10-year U.S. Treasury fell as demand for safe assets ascend again, today 10-year bond yields a positive 0.38% to 3.9780.
Oil prices were mixed in early Asian trade on Wednesday as support from US production cuts caused by Hurricane Ian contended with crude storage builds and a strong dollar.
Spot Brent crude oil subtract 0.99% to $84.01 per barrel. US West Texas Intermediate crude is down 1.17% to $77.61 a barrel.
The yellow metal gold is decline 0.40% to 1,629.80 dollars per ounce.
Market Wrap: Forex
The safe-haven U.S. dollar soared to a new 20-year high in early European trading Wednesday, as more hawkish Fed speak and rising Treasury yields spurred fresh recession fears.
Today, the U.S. dollar index measures the Greenback against a trade-weighted basket of six major currencies, which is rose 0.19% to 114.240.
The Euro US Dollar (EUR/USD) is a widely traded pair that is down 0.09% today. This left the pair trading around $0.95840.
The Japanese yen was positive against the U.S. dollar on Wednesday as the stock up. Today USD/JPY is drop 0.17% to 144.510 level.
Another commodity-related currency negative against the U.S dollar, AUD/USD slipped 0.54% to 0.63990, and NZD/USD subtract 0.60 to 0.56000 level.
EUR/USD Intraday: Trend on the downside
Our pivot point is at 0.96060
Preferable Price Action: Take sell positions below pivot level with targets at 0.94880 & 0.94100 in extension.
Alternative Price Action: Above pivot looks for a further upside to 0.96820 & 0.97490.
Comment: RSI below 50 levels and Pairs below its 20MA & 55MA.
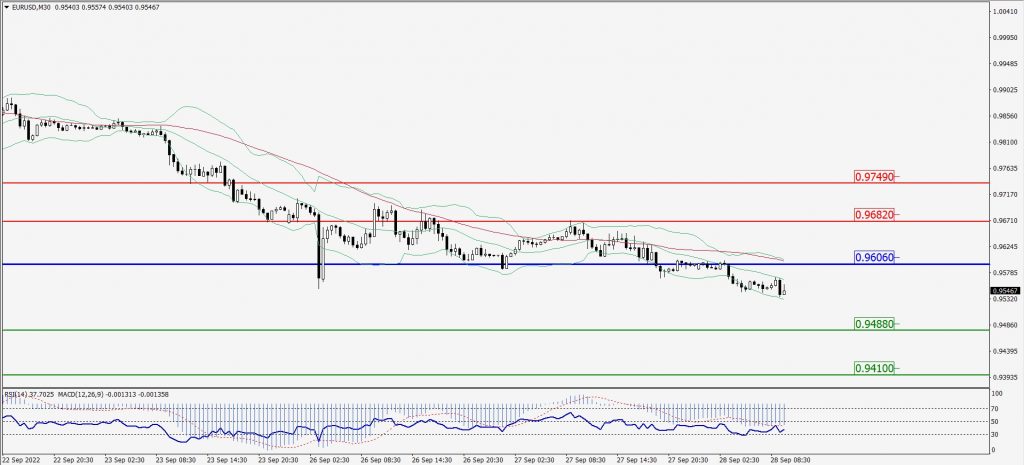
Green Lines Indicate Resistance Levels – Red Lines Indicate Support Levels
Light Blue is a Pivot Point – Black represents the price when the report was produced
GBP/USD Intraday: Trend on the downside
Our pivot point is at 1.07750
Preferable Price Action: Sell positions below pivot with targets at 1.04460 & 1.01920 in extension.
Alternative Price Action: The price above pivot would call for further upside to 1.10540 & 1.12720.
Comment: RSI below 50 levels and Pairs below its 20MA & 55MA.
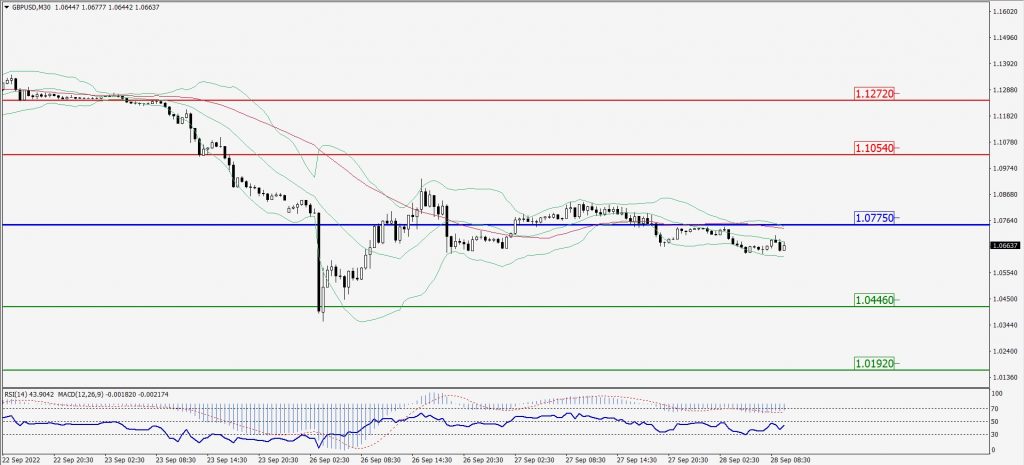
Green Lines Indicate Resistance Levels – Red Lines Indicate Support Levels
Light Blue is a Pivot Point – Black represents the price when the report was produced
USD/JPY Intraday: In a consolidation zone
Our pivot point is at 144.630
Preferable Price Action: Buy position above pivot with the target at 145.800 and 146.720 in extension.
Alternative Price Action: The downside breakout of the pivot would call for 143.560 and 142.780.
Comment: MACD is positive territory and Pairs above its 20MA.
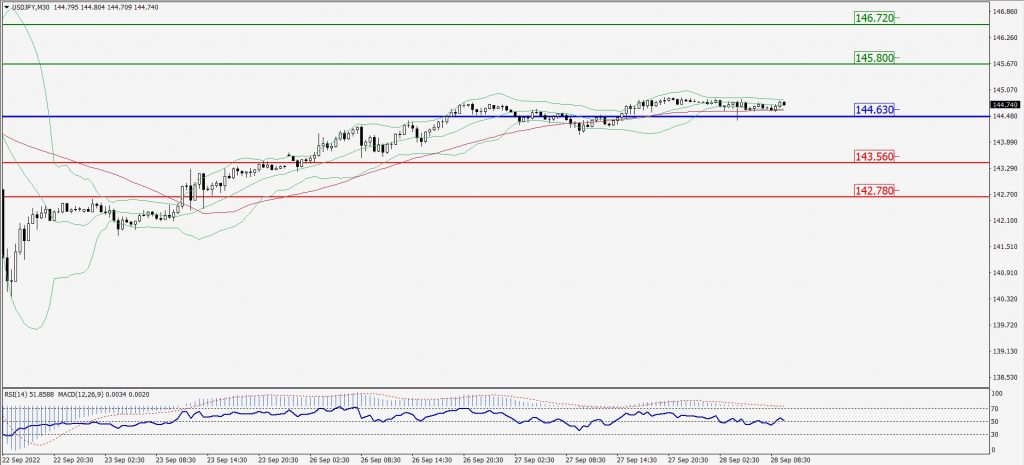
Green Lines Indicate Resistance Levels – Red Lines Indicate Support Levels
Light Blue is a Pivot Point – Black represents the price when the report was produced
AUD/USD Intraday: Trend on the downside
Our pivot point is at 0.64030
Preferable Price Action: Sell Positions below pivot with targets at 0.63160 & 0.62460 in extension.
Alternative Price Action: Above pivot looks for a further upside with 0.64820 & 0.65450 as targets.
Comment: RSI below 50 levels and Pairs below its 20MA & 55MA.
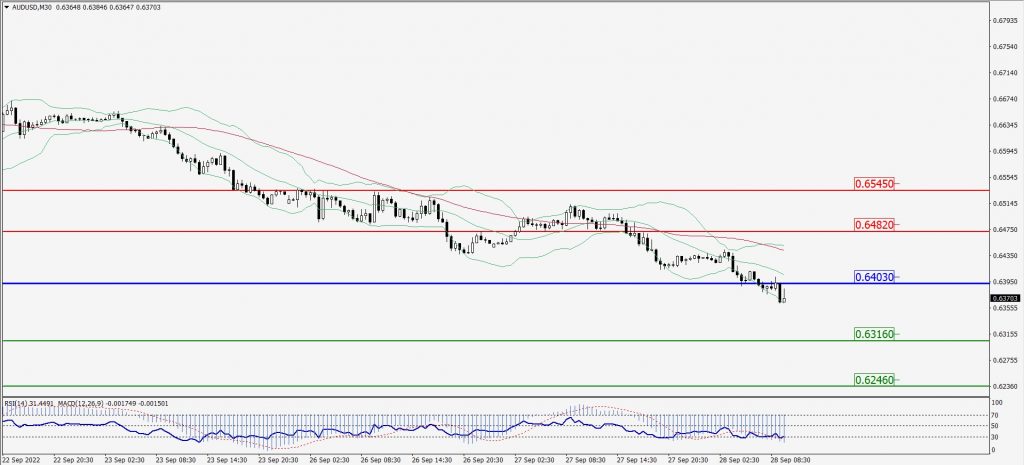
Green Lines Indicate Resistance Levels – Red Lines Indicate Support Levels
Light Blue is a Pivot Point – Black represents the price when the report was produced
CRUDEOIL Intraday: Resistance level at 77.63
Our pivot point is at 77.63
Preferable Price Action: Below pivots buy oil with 75.12 & 73.08 as targets.
Alternative Price Action: Buy crude above pivot with targets at 80.01 and 81.78 in extension.
Comment: MACD is in the negative territory and Pairs below its 20MA & 55MA.
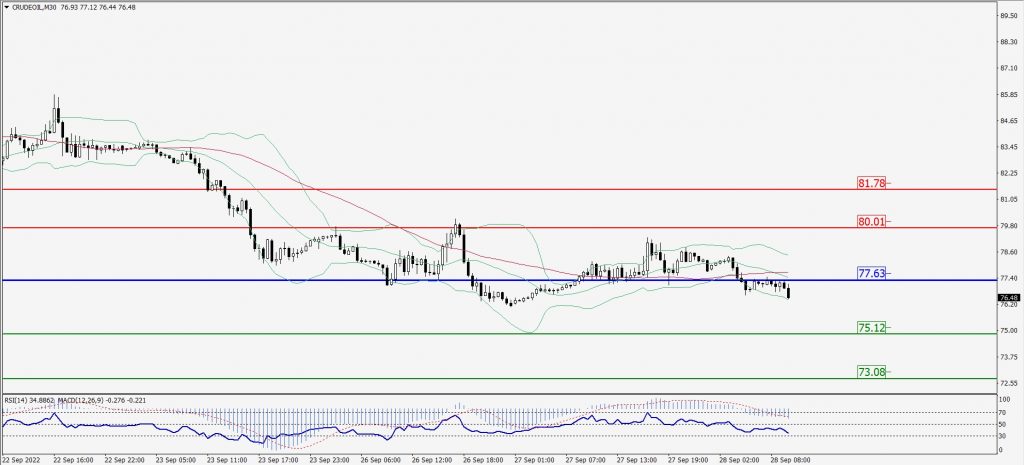
Green Lines Indicate Resistance Levels – Red Lines Indicate Support Levels
Light Blue is a Pivot Point – Black represents the price when the report was produced
XAU/USD Intraday: Trend on the downside
Our pivot point is 1627.90
Preferable Price Action: Further downside to 1606.00 and 1590.70
Alternative Price Action: If the price gives an upside breakout of a pivot, then the price extends to 1647.00 and 1662.30.
Comment: MACD is negative territory and Pairs below its 20MA & 55MA.
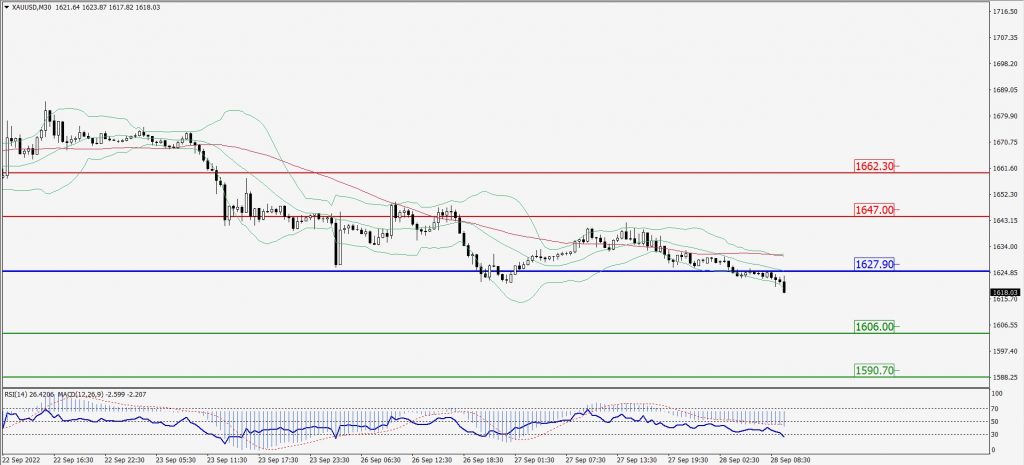
Green Lines Indicate Resistance Levels – Red Lines Indicate Support Levels
Light Blue is a Pivot Point – Black represents the price when the report was produced
Dow Jones Intraday: Resistance level at 29,147.00
Our pivot point is 29,147.00
Preferable Price Action: Take sell positions below pivot with targets at 28,684.00 & 28,356.00.
Alternative Price Action: Above 29,147.00 looks for further upside to 29,571.00 & 29,907.00.
Comment: RSI below 50 levels and Pairs below its 20MA & 55MA.
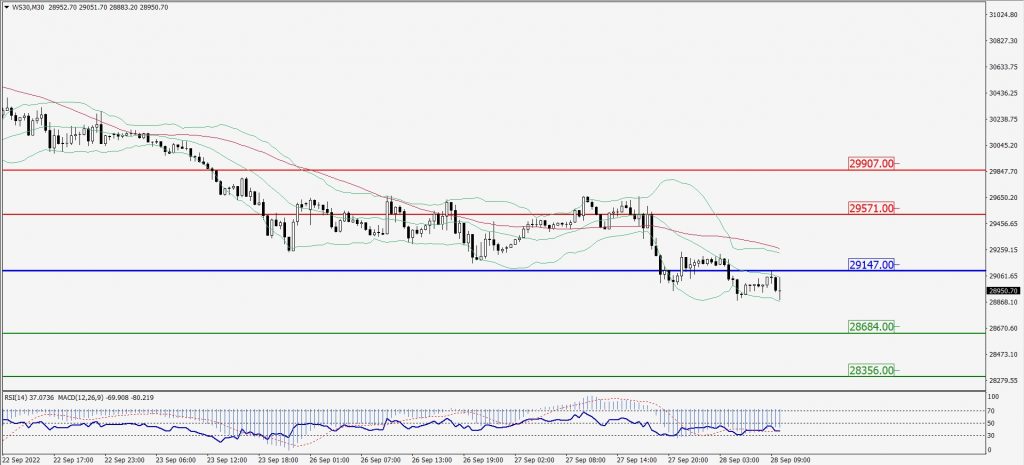
Green Lines Indicate Resistance Levels – Red Lines Indicate Support Levels
Light Blue is a Pivot Point – Black represents the price when the report was produced