Market Wrap: Stocks, Bonds, Commodities
Wall Street slid deeper into a bear market on Monday, with the S&P 500 and Dow closing lower as investors fretted that the Federal Reserve’s aggressive campaign against inflation could throw the US economy into a sharp downturn.
The Dow Jones Industrial Average fell 329.60 points to 29,260.81, the S&P 500 lose 38.19 points to 3,655.04 and the Nasdaq Composite subtract 65.00 points to 10,802.92.
MSCI’s index of Asia-Pacific stocks outside Japan is ascend 0.41% to 673.35 levels. Australian index higher 0.41% to 6,496.20. Japanese Nikkei Index ascend 0.53% to 26,571.87.
European stocks were positive on Tuesday, with the Stoxx Europe 50 Index rose 1.22% to 3,383.25, Germany’s DAX ascend 1.17% to 12,372.76, and France’s CAC add 1.20% to 5,838.43, and U.K.’s FTSE 100 surged 0.45% to 7,052.00.
Benchmark 10-year U.S. Treasury fell as demand for safe assets ascend again, today 10-year bond yields a negative 0.94% to 3.8430.
Brent crude fell below $85 a barrel on Monday, as recession fears weighed and the US dollar surged.
Spot Brent crude oil add 1.30% to $83.97 per barrel. US West Texas Intermediate crude is up 1.42% to $77.75 a barrel.
The yellow metal gold is advance 0.63% to 1,643.95 dollars per ounce.
Market Wrap: Forex
The British pound edged higher Tuesday, rebounding to a degree after falling to a record low against the U.S. dollar as traders paused for breath after a couple of volatile sessions.
Today, the U.S. dollar index measures the Greenback against a trade-weighted basket of six major currencies, which is fell 0.40% to 113.570.
The Euro US Dollar (EUR/USD) is a widely traded pair that is up 0.34% today. This left the pair trading around $0.96370.
The Japanese yen was positive against the U.S. dollar on Tuesday as the stock up. Today USD/JPY is drop 0.29% to 144.320 level.
Another commodity-related currency positive against the U.S dollar, AUD/USD surged 0.55% to 0.64900, and NZD/USD add 1.08 to 0.56960 level.
EUR/USD Intraday: Trend on the upside
Our pivot point is at 0.96500
Preferable Price Action: Take buy positions above pivot level with targets at 0.97910 & 0.98920 in extension.
Alternative Price Action: Below pivot looks for a further downside to 0.95310 & 0.94410.
Comment: RSI above 50 levels and Pairs above its 20MA & 55MA.
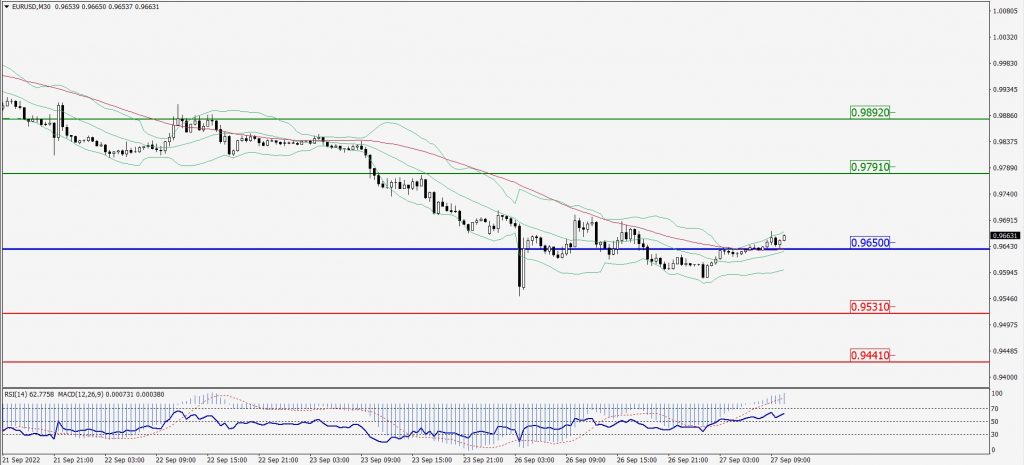
Green Lines Indicate Resistance Levels – Red Lines Indicate Support Levels
Light Blue is a Pivot Point – Black represents the price when the report was produced
GBP/USD Intraday: Trend on the upside
Our pivot point is at 1.07400
Preferable Price Action: Buy positions above pivot with targets at 1.10290 & 1.12330 in extension.
Alternative Price Action: The price below pivot would call for further downside to 1.04640 & 1.02600.
Comment: RSI above 50 levels and Pairs above its 20MA & 55MA.
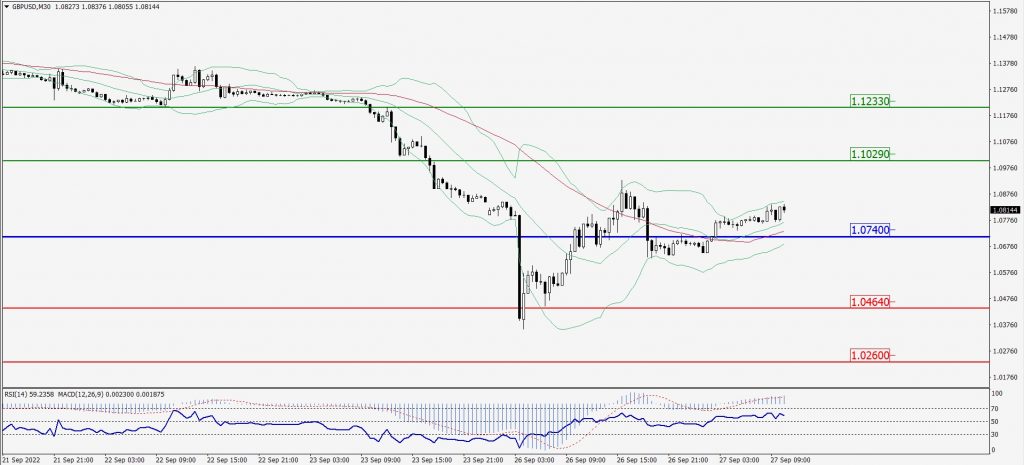
Green Lines Indicate Resistance Levels – Red Lines Indicate Support Levels
Light Blue is a Pivot Point – Black represents the price when the report was produced
USD/JPY Intraday: Resistance level at 144.710
Our pivot point is at 144.710
Preferable Price Action: Sell position below pivot with the target at 143.330 and 142.400 in extension.
Alternative Price Action: The upside breakout of the pivot would call for 146.150 and 147.160.
Comment: MACD is negative territory and Pairs below 20MA.
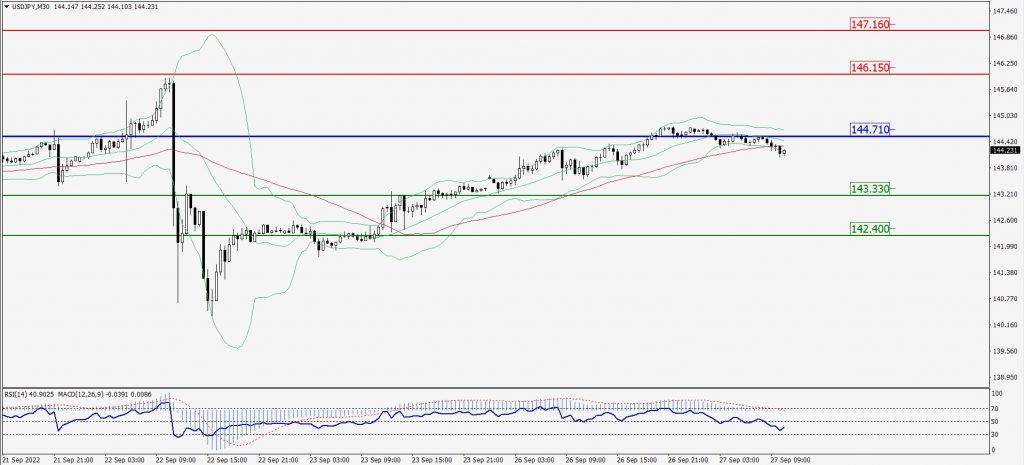
Green Lines Indicate Resistance Levels – Red Lines Indicate Support Levels
Light Blue is a Pivot Point – Black represents the price when the report was produced
AUD/USD Intraday: Support level at 0.64820
Our pivot point is at 0.64820
Preferable Price Action: Buy Positions above pivot with targets at 0.65570 & 0.66160 in extension.
Alternative Price Action: Below pivot looks for a further downside with 0.64120 & 0.63570 as targets.
Comment: RSI above 50 levels and Pairs above its 20MA & 55MA.
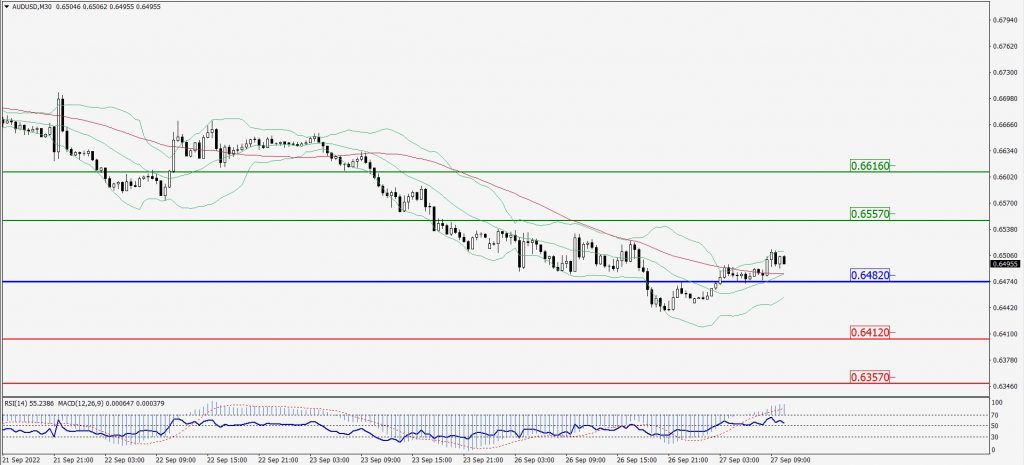
Green Lines Indicate Resistance Levels – Red Lines Indicate Support Levels
Light Blue is a Pivot Point – Black represents the price when the report was produced
CRUDEOIL Intraday: Trend on the upside
Our pivot point is at 77.41
Preferable Price Action: Above pivots buy oil with 80.50 & 82.75 as targets.
Alternative Price Action: Sell crude below pivot with targets at 74.80 and 72.51 in extension.
Comment: MACD is in the positive territory and Pairs above its 20MA & 55MA.
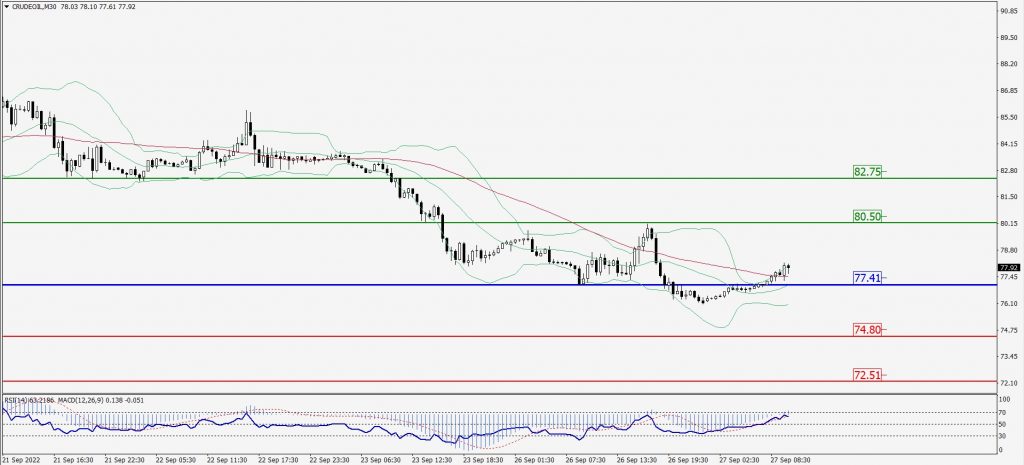
Green Lines Indicate Resistance Levels – Red Lines Indicate Support Levels
Light Blue is a Pivot Point – Black represents the price when the report was produced
XAU/USD Intraday: Trend on the upside
Our pivot point is 1633.60
Preferable Price Action: Further upside to 1651.20 and 1663.50
Alternative Price Action: If the price gives a downside breakout of a pivot, then the price extends to 1618.00 and 1605.90.
Comment: MACD is positive territory and Pairs above its 20MA & 55MA.
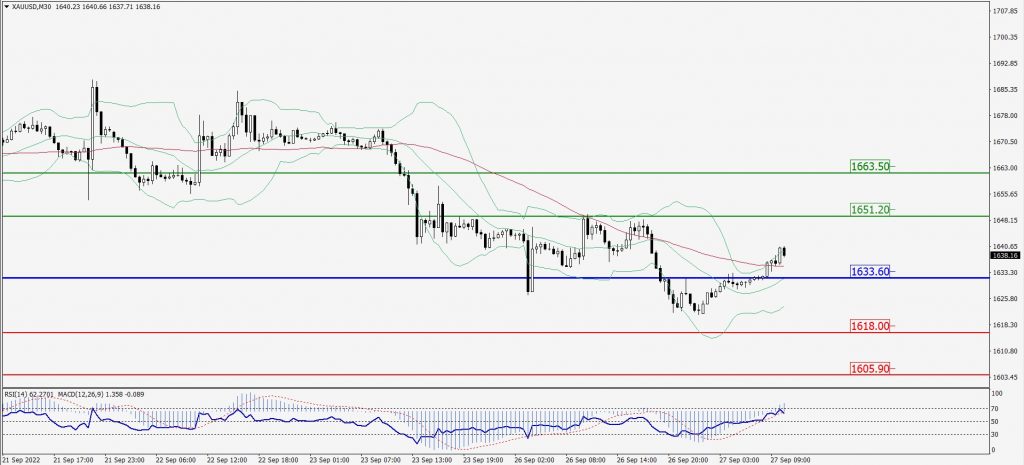
Green Lines Indicate Resistance Levels – Red Lines Indicate Support Levels
Light Blue is a Pivot Point – Black represents the price when the report was produced
Dow Jones Intraday: Support level at 29,477.00
Our pivot point is 29,477.00
Preferable Price Action: Take buy positions above pivot with targets at 30,132.00 & 30,630.00.
Alternative Price Action: Below 29,477.00 looks for further downside to 28,860.00 & 28,416.00.
Comment: RSI above 50 levels and Pairs above its 20MA & 55MA.
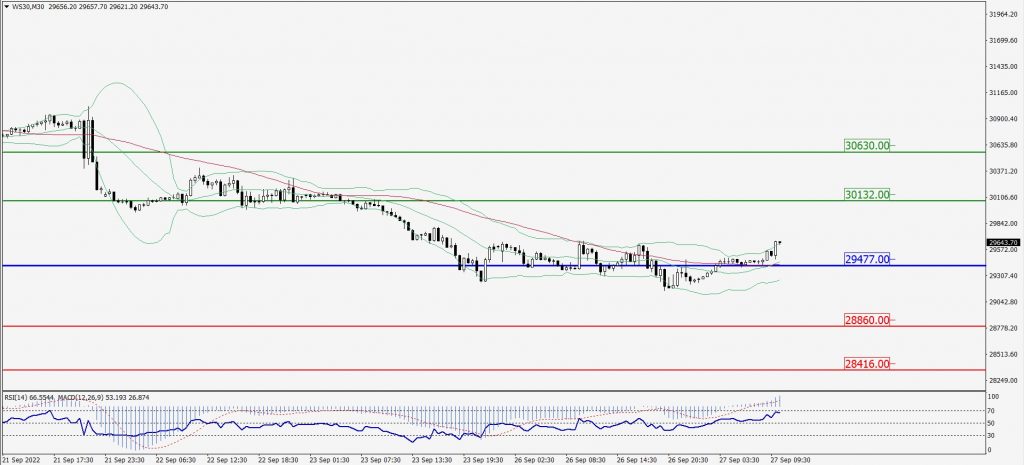
Green Lines Indicate Resistance Levels – Red Lines Indicate Support Levels
Light Blue is a Pivot Point – Black represents the price when the report was produced