Market Wrap: Stocks, Bonds, Commodities
The US and European stocks tumbled on Friday, the dollar scaled a 22-year high and bonds sold off again as fears grew that a central bank prescription of raising interest rates to tame inflation will drag major economies into recession.
The Dow Jones Industrial Average fell 486.27 points to 29,590.41, the S&P 500 lose 64.76 points to 3,693.23 and the Nasdaq Composite subtract 198.88 points to 10,867.93.
MSCI’s index of Asia-Pacific stocks outside Japan is drop 1.33% to 671.89 levels. Australian index lower 1.60% to 6,469.40. Japanese Nikkei Index drop 2.66% to 26,431.55.
European stocks were positive on Monday, with the Stoxx Europe 50 Index rose 0.30% to 3,358.75, Germany’s DAX ascend 0.08% to 12,294.14, and France’s CAC add 0.17% to 5,793.49, and U.K.’s FTSE 100 surged 0.15% to 7,028.03.
Benchmark 10-year U.S. Treasury fell as demand for safe assets ascend again, today 10-year bond yields a positive 2.05% to 3.7730.
Oil prices fell for a second day on Monday on fears of lower fuel demand from an expected global recession sparked by rising worldwide interest rates and as a surging U.S. dollar limits the ability of non-dollar consumers to purchase crude.
Spot Brent crude oil subtract 0.08% to $84.24 per barrel. US West Texas Intermediate crude is down 0.80% to $78.09 a barrel.
The yellow metal gold is decline 0.12% to 1,653.65 dollars per ounce.
Market Wrap: Forex
Most Asian currencies fell sharply against the dollar on Monday as fears of a global recession and rising interest rates in the West weighed heavily on risk-driven assets.
Today, the U.S. dollar index measures the Greenback against a trade-weighted basket of six major currencies, which is rose 0.18% to 113.170.
The Euro US Dollar (EUR/USD) is a widely traded pair that is down 0.73% today. This left the pair trading around $0.96750.
The Japanese yen was positive against the U.S. dollar on Monday as the stock up. Today USD/JPY is ascend 0.30% to 143.750 level.
Another commodity-related currency negative against the U.S dollar, AUD/USD slipped 0.12% to 0.65190, and NZD/USD down 0.09 to 0.57390 level.
EUR/USD Intraday: Trend on the upside
Our pivot point is at 0.96500
Preferable Price Action: Take buy positions above pivot level with targets at 0.97910 & 0.98920 in extension.
Alternative Price Action: Below pivot looks for a further downside to 0.95310 & 0.94410.
Comment: RSI above 50 levels and Pairs above 20MA.
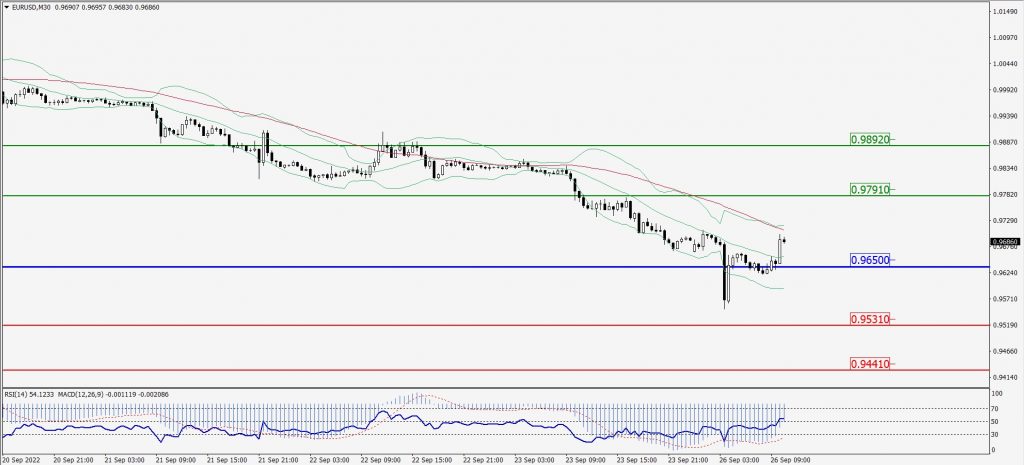
Green Lines Indicate Resistance Levels – Red Lines Indicate Support Levels
Light Blue is a Pivot Point – Black represents the price when the report was produced
GBP/USD Intraday: Trend on the upside
Our pivot point is at 1.06030
Preferable Price Action: Buy positions above pivot with targets at 1.09610 & 1.12260 in extension.
Alternative Price Action: The price below pivot would call for further downside to 1.03070 & 1.00430.
Comment: RSI above 50 levels and Pairs above 20MA.
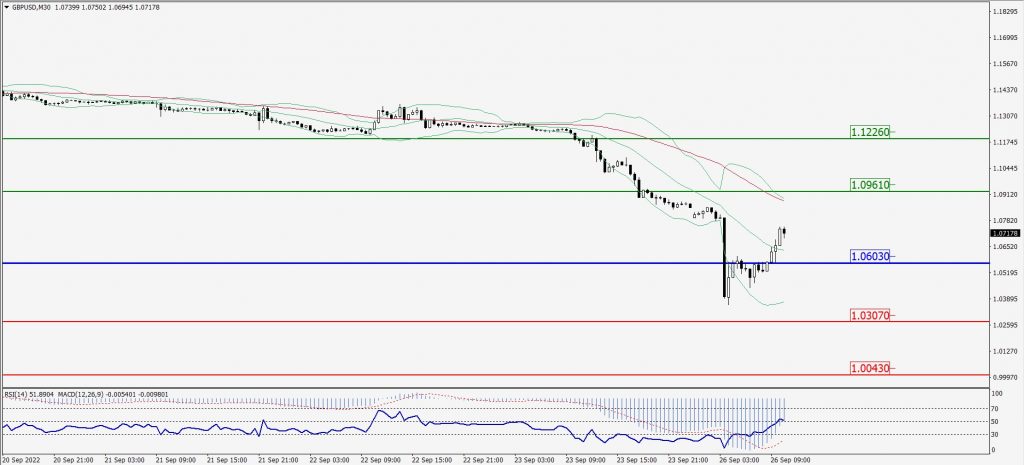
Green Lines Indicate Resistance Levels – Red Lines Indicate Support Levels
Light Blue is a Pivot Point – Black represents the price when the report was produced
USD/JPY Intraday: In a consolidation zone
Our pivot point is at 143.530
Preferable Price Action: Buy position above pivot with the target at 144.990 and 146.100 in extension.
Alternative Price Action: The downside breakout of the pivot would call for 142.160 and 140.980.
Comment: MACD is flat territory and Pairs below 55MA.
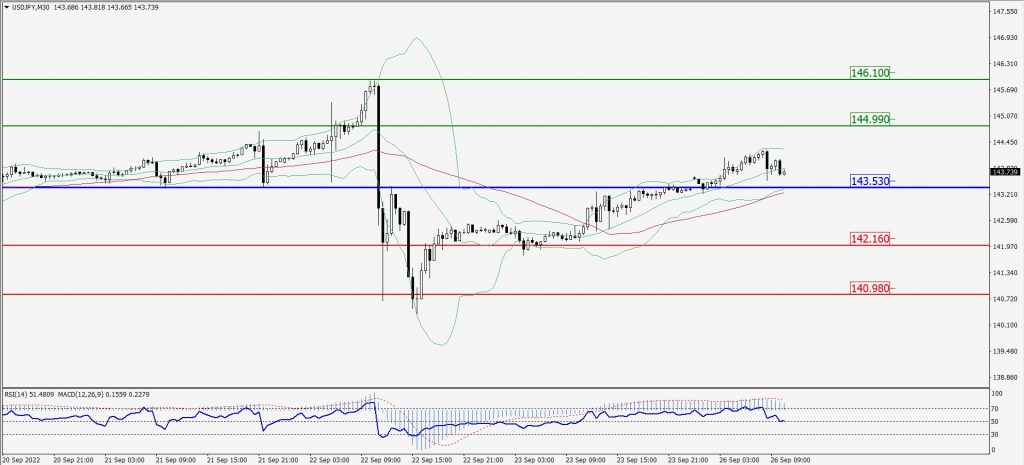
Green Lines Indicate Resistance Levels – Red Lines Indicate Support Levels
Light Blue is a Pivot Point – Black represents the price when the report was produced
AUD/USD Intraday: Support level at 0.65050
Our pivot point is at 0.65050
Preferable Price Action: Buy Positions above pivot with targets at 0.65720 & 0.66180 in extension.
Alternative Price Action: Below pivot looks for a further downside with 0.64530 & 0.64070 as targets.
Comment: RSI above 50 levels and Pairs above 20MA.
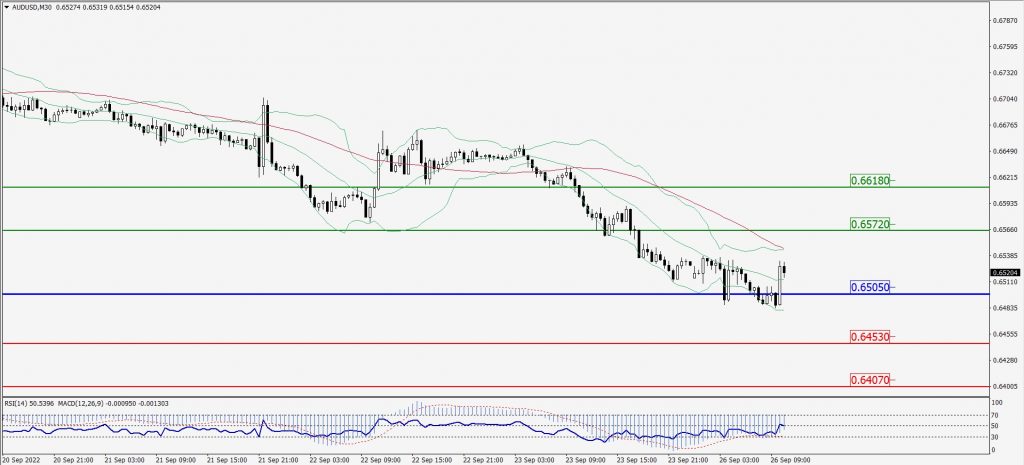
Green Lines Indicate Resistance Levels – Red Lines Indicate Support Levels
Light Blue is a Pivot Point – Black represents the price when the report was produced
CRUDEOIL Intraday: Trend on the downside
Our pivot point is at 79.59
Preferable Price Action: Below pivots sell oil with 76.89 & 74.92 as targets.
Alternative Price Action: Buy crude above pivot with targets at 82.19 and 83.97 in extension.
Comment: MACD is in the negative territory and Pairs below 55MA.
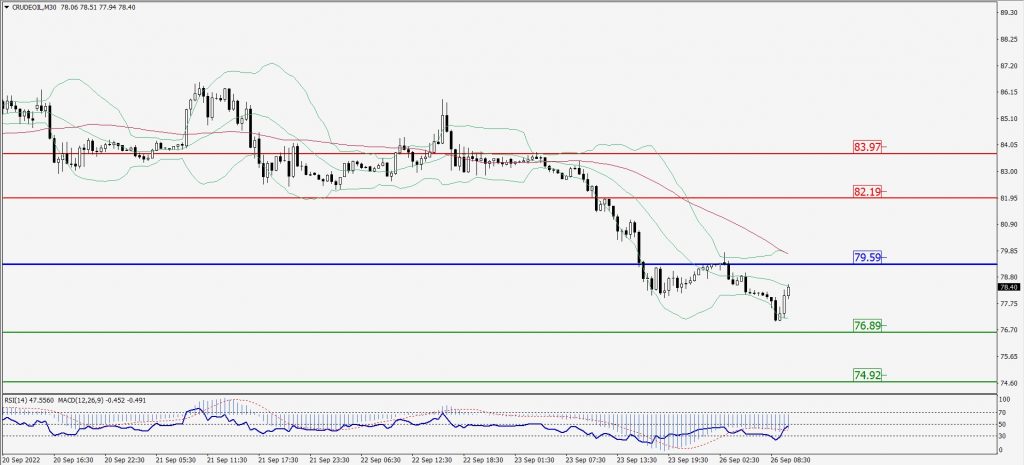
Green Lines Indicate Resistance Levels – Red Lines Indicate Support Levels
Light Blue is a Pivot Point – Black represents the price when the report was produced
XAU/USD Intraday: Support level at 1640.40
Our pivot point is 1640.40
Preferable Price Action: Further upside to 1656.80 and 1666.70
Alternative Price Action: If the price gives a downside breakout of a pivot, then the price extends to 1629.50 and 1618.40.
Comment: MACD is positive territory and Pairs above 20MA.
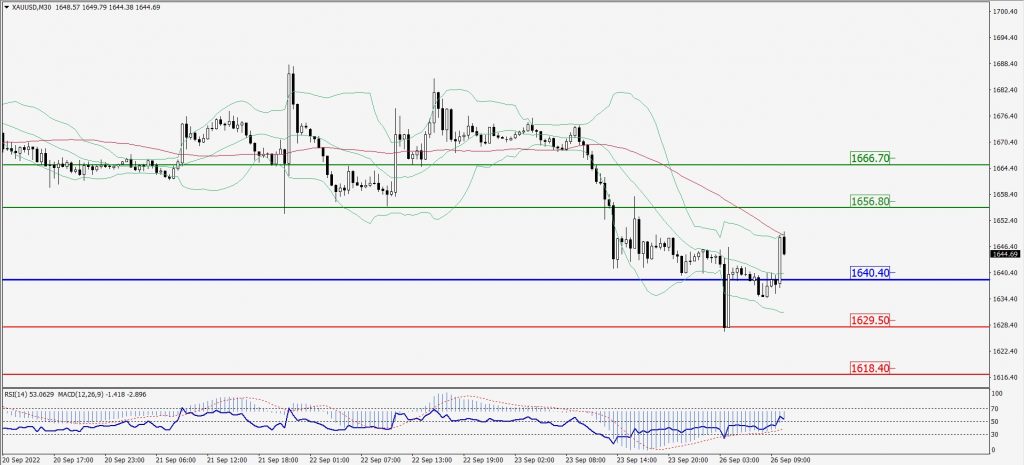
Green Lines Indicate Resistance Levels – Red Lines Indicate Support Levels
Light Blue is a Pivot Point – Black represents the price when the report was produced
Dow Jones Intraday: Trend on the upside
Our pivot point is 29,526.00
Preferable Price Action: Take buy positions above pivot with targets at 30,099.00 & 30,519.00.
Alternative Price Action: Below 29,526.00 looks for further upside to 29,048.00 & 28,633.00.
Comment: RSI above 50 levels and Pairs above 20MA.
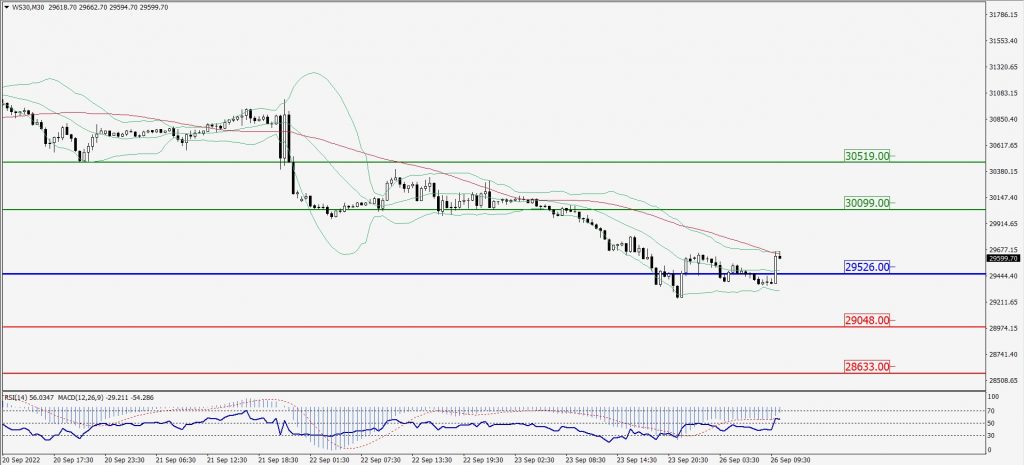
Green Lines Indicate Resistance Levels – Red Lines Indicate Support Levels
Light Blue is a Pivot Point – Black represents the price when the report was produced