Market Wrap: Stocks, Bonds, Commodities
Major Wall Street indexes ended lower on Thursday, falling for a third straight session as investors reacted to the Federal Reserve’s latest aggressive move to rein in inflation by selling growth stocks, including technology companies.
The Dow Jones Industrial Average fell 107.10 points to 30,076.68, the S&P 500 lose 31.94 points to 3,757.99 and the Nasdaq Composite subtract 153.39 points to 11,066.80.
MSCI’s index of Asia-Pacific stocks outside Japan is drop 1.28% to 681.52 levels. Australian index lower 1.87% to 6,574.70. Japanese Nikkei Index drop 0.58% to 27,153.83.
European stocks were negative on Friday, with the Stoxx Europe 50 Index fell 0.71% to 3,402.85, Germany’s DAX drop 0.52% to 12,468.37, and France’s CAC subtract 0.44% to 5,892.47, and U.K.’s FTSE 100 slipped 0.68% to 7,111.45.
Benchmark 10-year U.S. Treasury fell as demand for safe assets ascend again, today 10-year bond yields a negative 0.52% to 3.6890.
Oil prices rose in early Asian trade on Friday on the prospect that a stalled Iran nuclear agreement and Moscow’s new mobilization campaign in its invasion of Ukraine would further restrict global supplies.
Spot Brent crude oil subtract 1.48% to $89.16 per barrel. US West Texas Intermediate crude is down 1.57% to $82.19 a barrel.
The yellow metal gold is decline 0.46% to 1,673.45 dollars per ounce.
Market Wrap: Forex
The U.S. dollar edged higher in early European trading Friday, remaining in demand after the Federal Reserve’s hawkish stance, while the yen was buoyant after the intervention of Japanese authorities.
Today, the U.S. dollar index measures the Greenback against a trade-weighted basket of six major currencies, which is rose 0.53% to 111.690.
The Euro US Dollar (EUR/USD) is a widely traded pair that is down 0.73% today. This left the pair trading around $0.97650.
The Japanese yen was positive against the U.S. dollar on Friday as the stock up. Today USD/JPY is ascend 0.05% to 142.440 level.
Another commodity-related currency negative against the U.S dollar, AUD/USD slipped 0.75% to 0.65930, and NZD/USD down 0.66 to 0.58090 level.
EUR/USD Intraday: Trend on the downside
Our pivot point is at 0.98250
Preferable Price Action: Take sell positions below pivot level with targets at 0.97250 & 0.96630 in extension.
Alternative Price Action: Above pivot looks for a further upside to 0.99060 & 0.99670.
Comment: RSI below 50 levels and Pairs below its 20MA & 55MA.
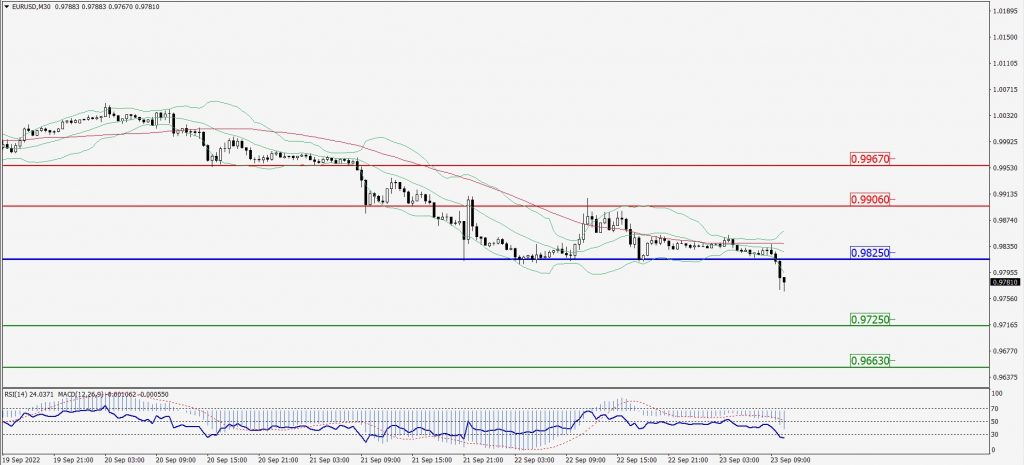
Green Lines Indicate Resistance Levels – Red Lines Indicate Support Levels
Light Blue is a Pivot Point – Black represents the price when the report was produced
GBP/USD Intraday: Trend on the downside
Our pivot point is at 1.12390
Preferable Price Action: Sell positions below pivot with targets at 1.11320 & 1.10550 in extension.
Alternative Price Action: The price above pivot would call for further upside to 1.13200 & 1.13970.
Comment: RSI below 50 levels and Pairs below its 20MA & 55MA.
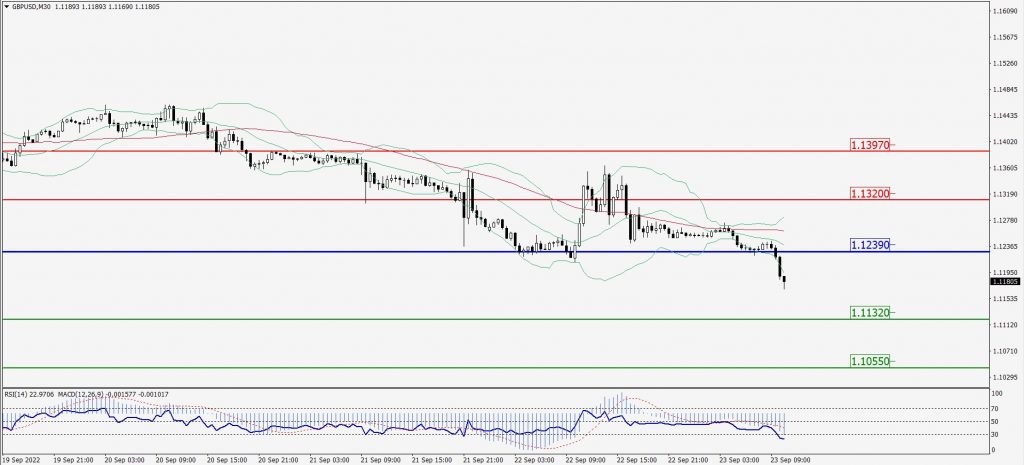
Green Lines Indicate Resistance Levels – Red Lines Indicate Support Levels
Light Blue is a Pivot Point – Black represents the price when the report was produced
USD/JPY Intraday: In a consolidation zone
Our pivot point is at 142.650
Preferable Price Action: Sell position below pivot with the target at 141.040 and 139.910 in extension.
Alternative Price Action: The upside breakout of the pivot would call for 144.200 and 145.450.
Comment: MACD is negative territory and Pairs below 55MA.
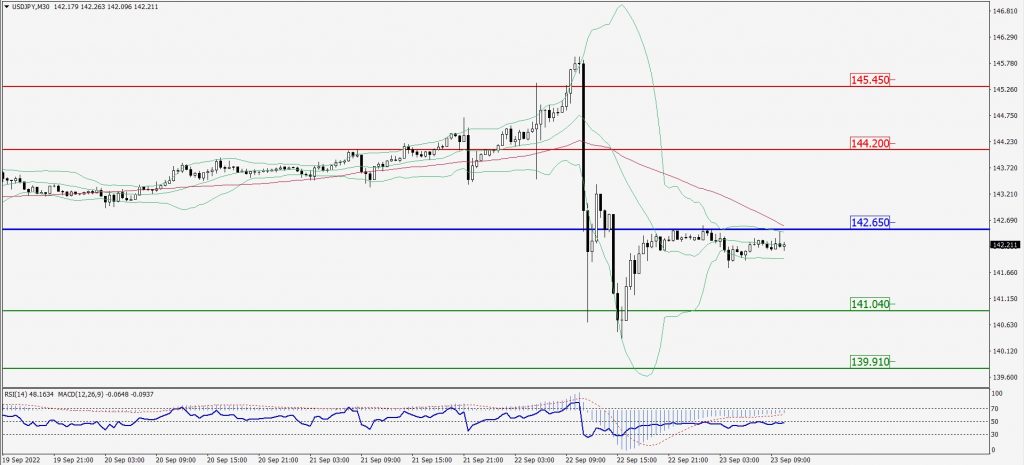
Green Lines Indicate Resistance Levels – Red Lines Indicate Support Levels
Light Blue is a Pivot Point – Black represents the price when the report was produced
AUD/USD Intraday: Resistance level at 0.66400
Our pivot point is at 0.66400
Preferable Price Action: Sell Positions below pivot with targets at 0.65700 & 0.65180 in extension.
Alternative Price Action: Above pivot looks for a further upside with 0.66990 & 0.67500 as targets.
Comment: RSI below 50 levels and Pairs below its 20MA & 55MA.
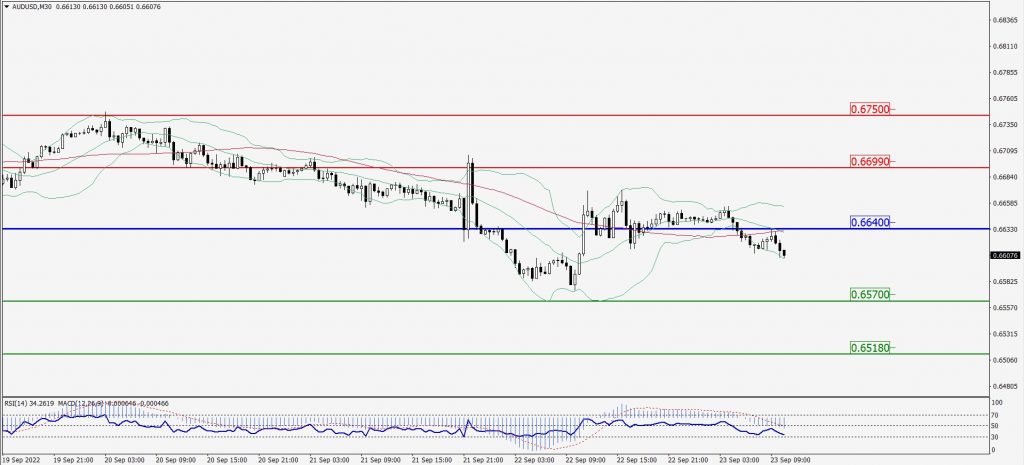
Green Lines Indicate Resistance Levels – Red Lines Indicate Support Levels
Light Blue is a Pivot Point – Black represents the price when the report was produced
CRUDEOIL Intraday: Resistance level at 83.34
Our pivot point is at 83.34
Preferable Price Action: Below pivots sell oil with 80.77 & 79.08 as targets.
Alternative Price Action: Buy crude above pivot with targets at 85.41 and 87.28 in extension.
Comment: MACD is in the negative territory and Pairs below its 20MA & 55MA.
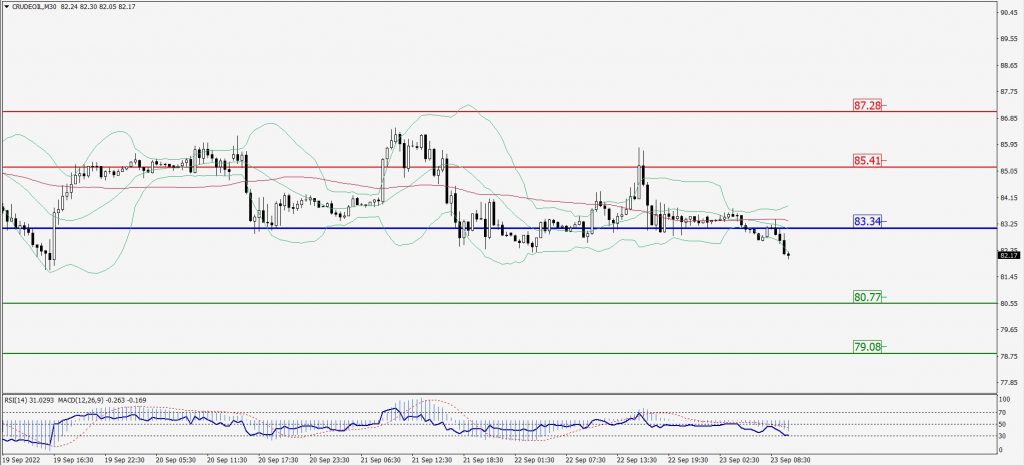
Green Lines Indicate Resistance Levels – Red Lines Indicate Support Levels
Light Blue is a Pivot Point – Black represents the price when the report was produced
XAU/USD Intraday: Trend on the downside
Our pivot point is 1675.60
Preferable Price Action: Further downside to 1658.50 and 1648.20
Alternative Price Action: If the price gives an upside breakout of a pivot, then the price extends to 1688.70 and 1698.10.
Comment: MACD is negative territory and Pairs below 20MA.
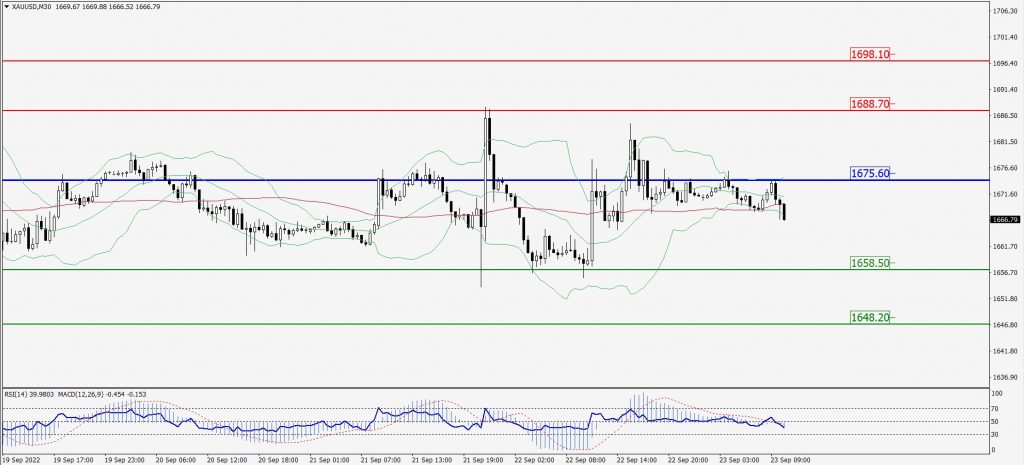
Green Lines Indicate Resistance Levels – Red Lines Indicate Support Levels
Light Blue is a Pivot Point – Black represents the price when the report was produced
Dow Jones Intraday: Trend on the downside
Our pivot point is 30,100.00
Preferable Price Action: Take sell positions below pivot with targets at 29,728.00 & 29,436.00.
Alternative Price Action: Above 30,100.00 looks for further upside to 30,447.00 & 30,715.00.
Comment: RSI below 50 levels and Pairs below its 20MA & 55MA.
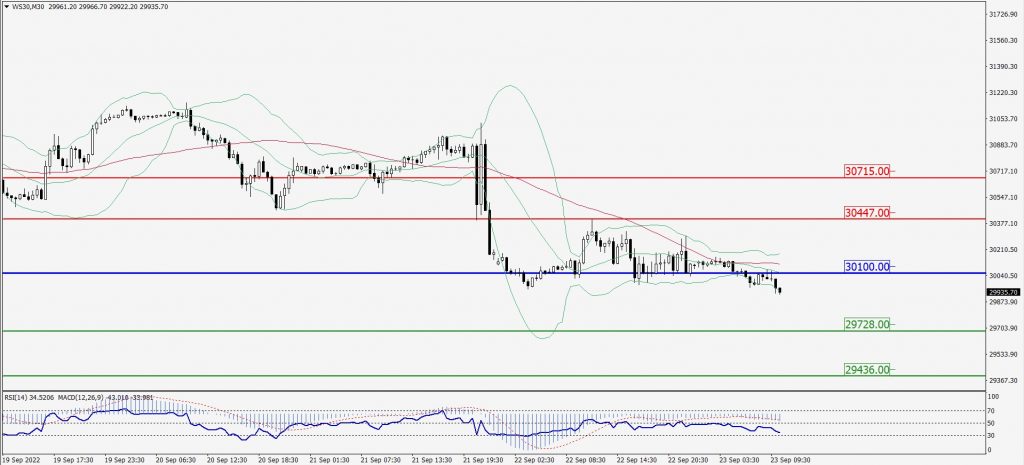
Green Lines Indicate Resistance Levels – Red Lines Indicate Support Levels
Light Blue is a Pivot Point – Black represents the price when the report was produced