Market Wrap: Stocks, Bonds, Commodities
US stocks ended in the red on Friday, falling to two-month lows as a warning of impending global slowdown from FedEx hastened investors’ flight to safety at the conclusion of a tumultuous week.
The Dow Jones Industrial Average fell 139.40 points to 30,822.42, the S&P 500 lose 28.02 points to 3,873.33 and the Nasdaq Composite subtract 103.95 points to 11,448.40.
MSCI’s index of Asia-Pacific stocks outside Japan is drop 0.70% to 601.33 levels. Australian index lower 0.28% to 6,719.90. Japanese Nikkei Index drop 1.11% to 27,567.65.
European stocks were negative on Monday, with the Stoxx Europe 50 Index fell 0.66% to 3,477.35, Germany’s DAX drop 0.37% to 12,695.58, and France’s CAC subtract 0.99% to 6,017.70, and U.K.’s FTSE 100 slipped 0.62% to 7,236.68.
Benchmark 10-year U.S. Treasury fell as demand for safe assets ascend again, today 10-year bond yields a positive 0.02% to 3.4480.
Oil prices climbed during early Asian trade on Monday as a weaker dollar and supply concerns ahead of the European Union embargo on Russian oil in December offset fears of a global recession that could dampen fuel demand.
Spot Brent crude oil subtract 1.46% to $90.02 per barrel. US West Texas Intermediate crude is down 1.81% to $83.25 a barrel.
The yellow metal gold is decline 0.81% to 1,669.95 dollars per ounce.
Market Wrap: Forex
The U.S. dollar edged higher Monday, remaining near a 20-year high at the start of a week dominated by a number of central bank meetings, including a crucial Federal Reserve gathering.
Today, the U.S. dollar index measures the Greenback against a trade-weighted basket of six major currencies, which is rose 0.25% to 109.790.
The Euro US Dollar (EUR/USD) is a widely traded pair that is down 0.37% today. This left the pair trading around $0.99770.
The Japanese yen was positive against the U.S. dollar on Monday as the stock up. Today USD/JPY is ascend 0.40% to 143.490 level.
Another commodity-related currency negative against the U.S dollar, AUD/USD slipped 0.50% to 0.66860, and NZD/USD down 0.73 to 0.59540 level.
EUR/USD Intraday: Major resistance level at 1.00130
Our pivot point is at 1.00130
Preferable Price Action: Take sell positions below pivot level with targets at 0.99130 & 0.98330 in extension.
Alternative Price Action: Above pivot looks for a further upside to 1.01130 & 1.01920.
Comment: RSI below 50 levels and Pairs below its 20MA & 55MA.
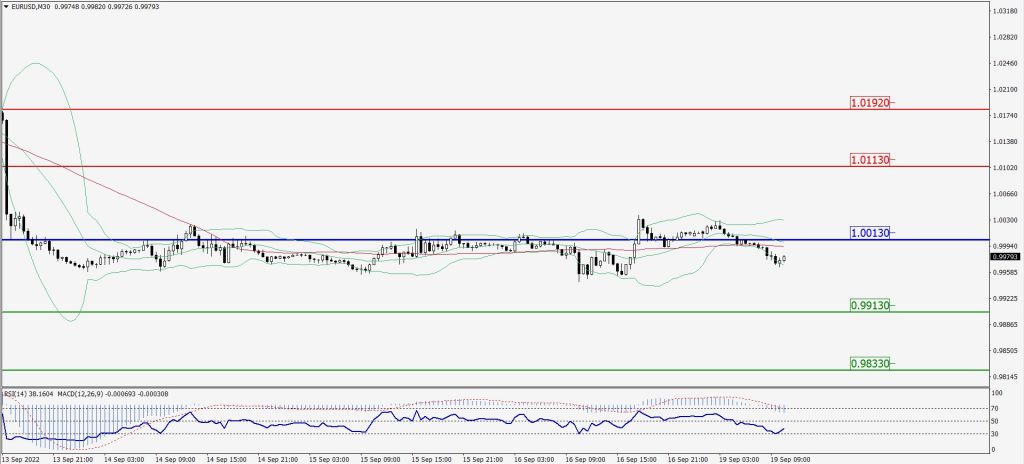
Green Lines Indicate Resistance Levels – Red Lines Indicate Support Levels
Light Blue is a Pivot Point – Black represents the price when the report was produced
GBP/USD Intraday: Trend on the downside
Our pivot point is at 1.14380
Preferable Price Action: Sell positions below pivot with targets at 1.13000 & 1.12010 in extension.
Alternative Price Action: The price above pivot would call for further upside to 1.15450 & 1.16450.
Comment: RSI below 50 levels and Pairs below its 20MA & 55MA.
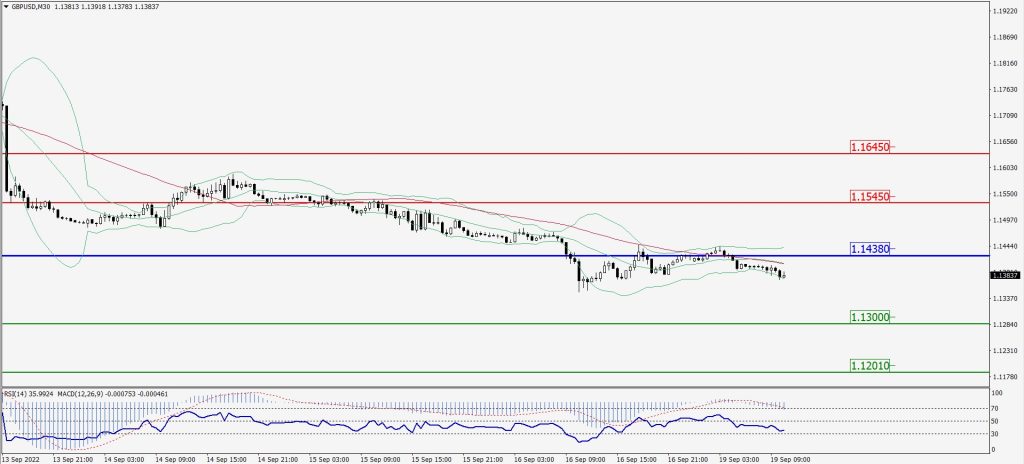
Green Lines Indicate Resistance Levels – Red Lines Indicate Support Levels
Light Blue is a Pivot Point – Black represents the price when the report was produced
USD/JPY Intraday: Trend on the upside
Our pivot point is at 143.300
Preferable Price Action: Buy position above pivot with the target at 144.200 and 144.800 in extension.
Alternative Price Action: The downside breakout of the pivot would call for 142.500 and 141.900.
Comment: MACD is positive territory and Pairs above its 20MA & 55MA.
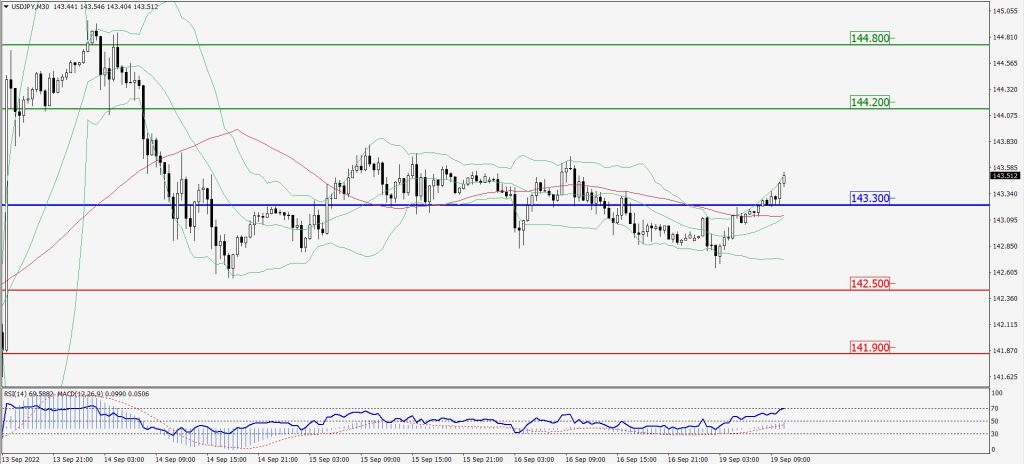
Green Lines Indicate Resistance Levels – Red Lines Indicate Support Levels
Light Blue is a Pivot Point – Black represents the price when the report was produced
AUD/USD Intraday: Trend on the downside
Our pivot point is at 0.67320
Preferable Price Action: Sell Positions below pivot with targets at 0.66140 & 0.65340 in extension.
Alternative Price Action: Above pivot looks for a further upside with 0.68260 & 0.69080 as targets.
Comment: RSI below 50 levels and Pairs below its 20MA & 55MA.
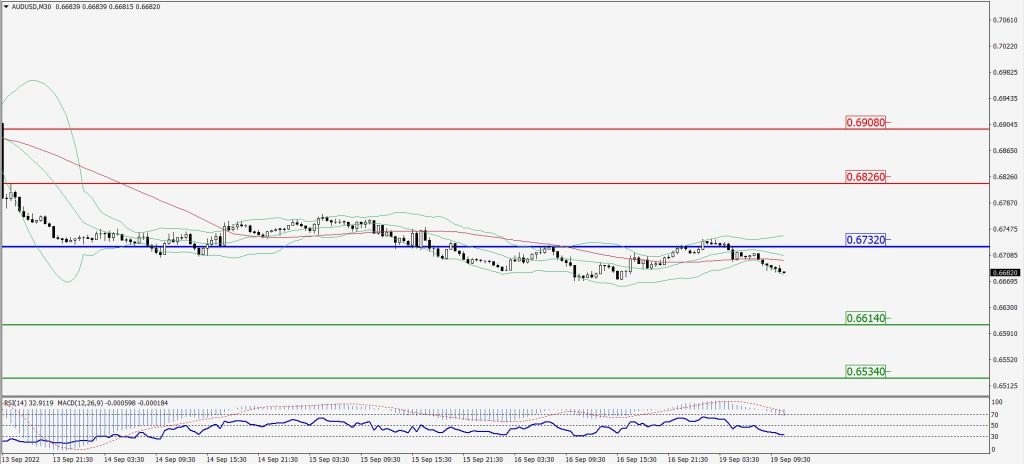
Green Lines Indicate Resistance Levels – Red Lines Indicate Support Levels
Light Blue is a Pivot Point – Black represents the price when the report was produced
CRUDEOIL Intraday: Major trend on the downside
Our pivot point is at 84.97
Preferable Price Action: Below pivots sell oil with 81.97 & 79.61 as targets.
Alternative Price Action: Buy crude above pivot with targets at 87.53 and 89.51 in extension.
Comment: MACD is in the negative territory and Pairs below its 20MA & 55MA.
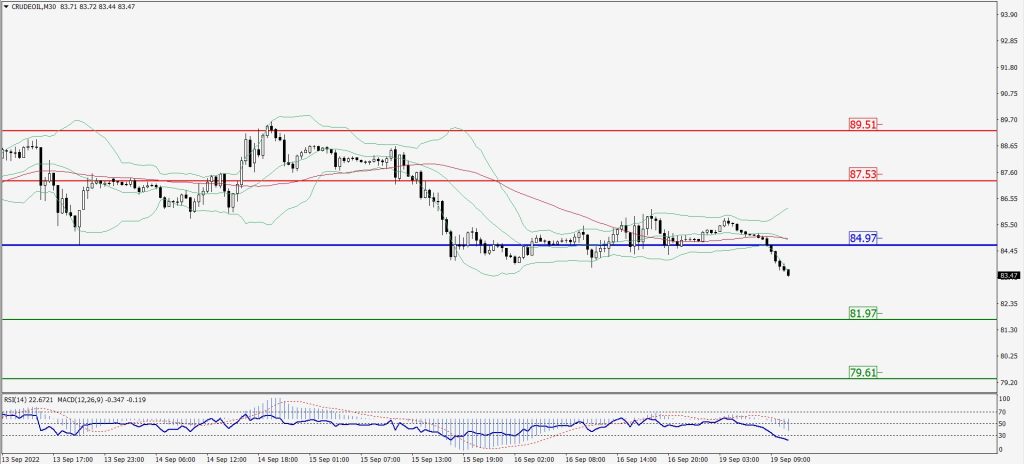
Green Lines Indicate Resistance Levels – Red Lines Indicate Support Levels
Light Blue is a Pivot Point – Black represents the price when the report was produced
XAU/USD Intraday: Trend on the downside
Our pivot point is 1674.20
Preferable Price Action: Further downside to 1641.40 and 1617.50
Alternative Price Action: If the price gives an upside breakout of a pivot, then the price extends to 1703.70 and 1726.30.
Comment: MACD is negative territory and Pairs below its 20MA & 55MA.
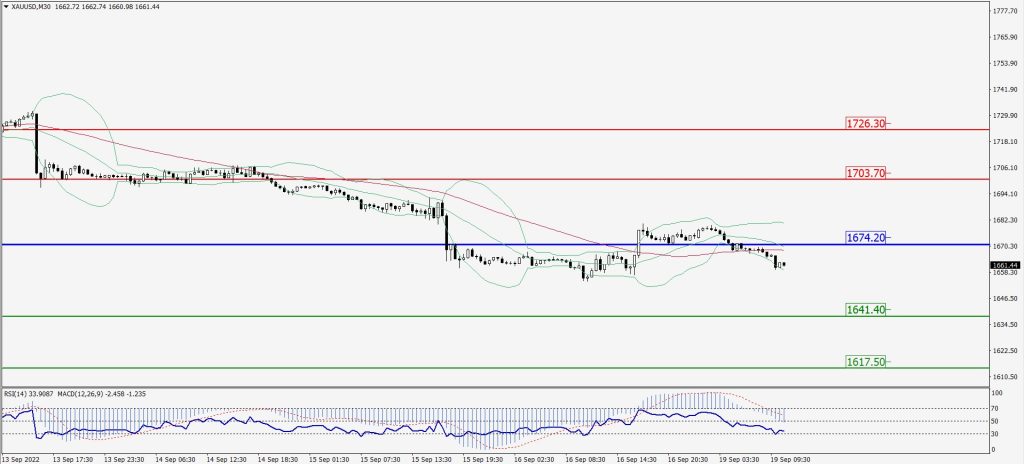
Green Lines Indicate Resistance Levels – Red Lines Indicate Support Levels
Light Blue is a Pivot Point – Black represents the price when the report was produced
Dow Jones Intraday: Trend on the downside
Our pivot point is 30,973.00
Preferable Price Action: Take sell positions below pivot with targets at 30,198.00 & 29,715.00.
Alternative Price Action: Above 30,973.00 looks for further upside to 31,619.00 & 32,085.00.
Comment: RSI below 50 levels and Pairs below its 20MA & 55MA.
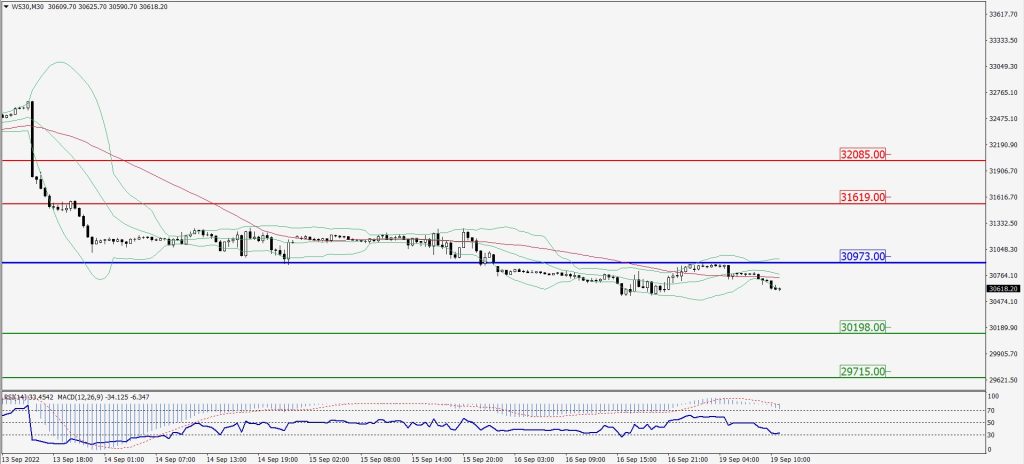
Green Lines Indicate Resistance Levels – Red Lines Indicate Support Levels
Light Blue is a Pivot Point – Black represents the price when the report was produced