Market Wrap: Stocks, Bonds, Commodities
Wall Street’s main indices posted gains on Thursday mainly lifted by financial institutions and healthcare companies, as investors digested hawkish remarks from policymakers that cemented bets of a large interest rate hike later this month.
The Dow Jones Industrial Average rose 193.24 points to 31,774.52, the S&P 500 gain 26.31 points to 4,006.18 and the Nasdaq Composite add 70.23 points to 11,862.13.
MSCI’s index of Asia-Pacific stocks outside Japan is ascend 1.33% to 622.64 levels. Australian index higher 0.66% to 6,894.20. Japanese Nikkei Index ascend 0.53% to 28,214.75.
European stocks were positive on Friday, with the Stoxx Europe 50 Index rose 1.27% to 3,557.15, Germany’s DAX ascend 1.17% to 13,056.24, and France’s CAC add 1.08% to 6,192.35, and U.K.’s FTSE 100 surged 1.28% to 7,354.26.
Benchmark 10-year U.S. Treasury fell as demand for safe assets ascend again, today 10-year bond yields a positive 0.60% to 3.3120.
Oil prices rose on Friday as investors considered Russia’s threat to halt oil and gas exports to some buyers, but crude was set for a second weekly decline as central banks’ aggressive rate hikes and China’s COVID-19 curbs weighed on demand.
Spot Brent crude oil add 1.38% to $90.40 per barrel. US West Texas Intermediate crude is up 1.28% to $84.64 a barrel.
The yellow metal gold is advance 1.05% to 1,738.15 dollars per ounce.
Market Wrap: Forex
The U.S. dollar dropped sharply in early European trade Friday after hawkish comments from the European Central Bank prompted traders to reassess global rate hike expectations.
Today, the U.S. dollar index measures the Greenback against a trade-weighted basket of six major currencies, which is fell 1.13% to 108.460.
The Euro US Dollar (EUR/USD) is a widely traded pair that is up 1.10% today. This left the pair trading around $1.01050.
The Japanese yen was positive against the U.S. dollar on Friday as the stock up. Today USD/JPY is drop 1.29% to 142.230 level.
Another commodity-related currency positive against the U.S dollar, AUD/USD surged 1.67% to 0.68650, and NZD/USD up 1.35 to 0.61350 level.
EUR/USD Intraday: Support level at 1.00740
Our pivot point is at 1.00740
Preferable Price Action: Take buy positions above pivot level with targets at 1.01420 & 1.01840 in extension.
Alternative Price Action: Below pivot looks for a further downside to 1.00260 & 0.99860.
Comment: RSI above 50 levels and Pairs above its 20MA & 55MA.
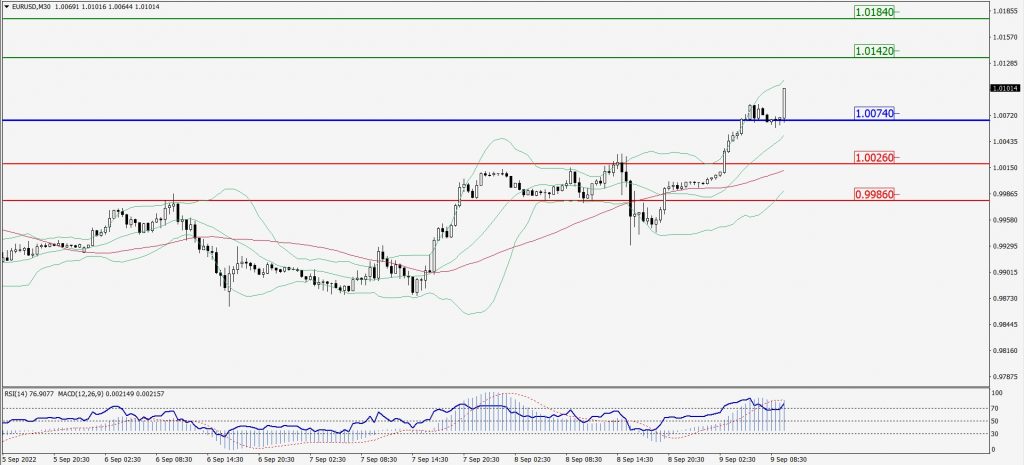
Green Lines Indicate Resistance Levels – Red Lines Indicate Support Levels
Light Blue is a Pivot Point – Black represents the price when the report was produced
GBP/USD Intraday: Trend on the upside
Our pivot point is at 1.16120
Preferable Price Action: Buy positions above pivot with targets at 1.16900 & 1.17460 in extension.
Alternative Price Action: The price below pivot would call for further downside to 1.15450 & 1.14870.
Comment: RSI above 50 levels and Pairs above its 20MA & 55MA.
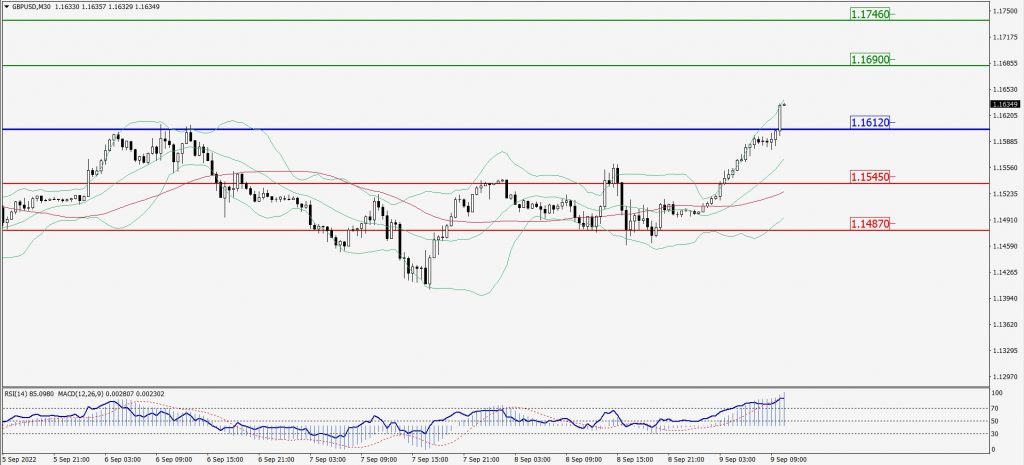
Green Lines Indicate Resistance Levels – Red Lines Indicate Support Levels
Light Blue is a Pivot Point – Black represents the price when the report was produced
USD/JPY Intraday: Trend on the downside
Our pivot point is at 142.740
Preferable Price Action: Sell position below pivot with the target at 141.430 and 140.420 in extension.
Alternative Price Action: The upside breakout of the pivot would call for 143.920 and 144.890.
Comment: MACD is negative territory and Pairs below its 20MA & 55MA.
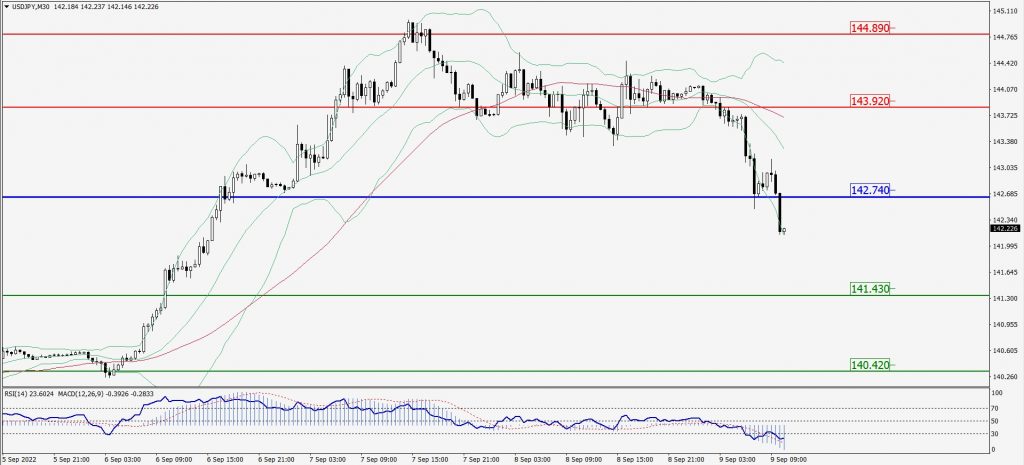
Green Lines Indicate Resistance Levels – Red Lines Indicate Support Levels
Light Blue is a Pivot Point – Black represents the price when the report was produced
AUD/USD Intraday: Major trend on the upside
Our pivot point is at 0.68410
Preferable Price Action: Buy Positions above pivot with targets at 0.69090 & 0.69540 in extension.
Alternative Price Action: Below pivot looks for a further downside with 0.67820 & 0.67380 as targets.
Comment: RSI above 50 levels and Pairs above its 20MA & 55MA.
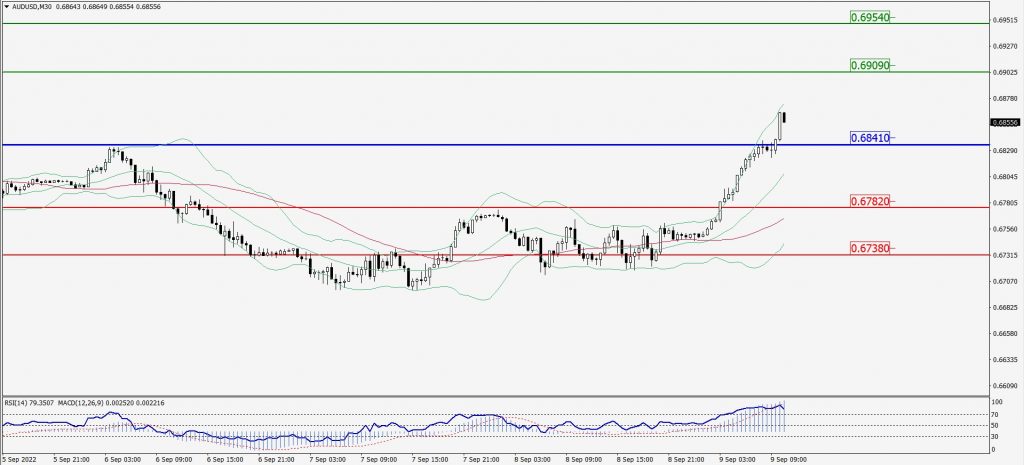
Green Lines Indicate Resistance Levels – Red Lines Indicate Support Levels
Light Blue is a Pivot Point – Black represents the price when the report was produced
CRUDEOIL Intraday: Support level at 83.38
Our pivot point is at 83.38
Preferable Price Action: Above pivots buy oil with 85.38 & 87.10 as targets.
Alternative Price Action: Sell crude below pivot with targets at 81.29 and 79.67 in extension.
Comment: MACD is in the positive territory and Pairs above 55MA.
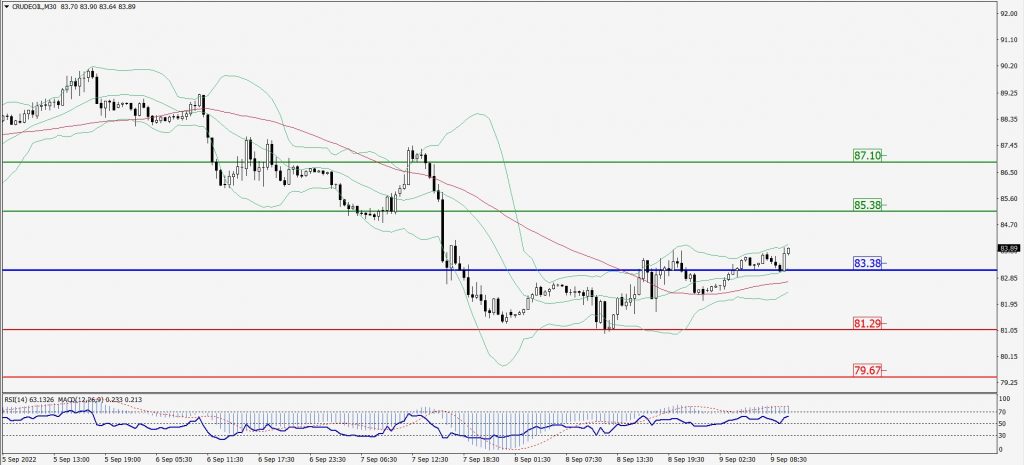
Green Lines Indicate Resistance Levels – Red Lines Indicate Support Levels
Light Blue is a Pivot Point – Black represents the price when the report was produced
XAU/USD Intraday: Trend on the upside
Our pivot point is 1722.70
Preferable Price Action: Further upside to 1739.40 and 1750.60
Alternative Price Action: If the price gives a downside breakout of a pivot, then the price extends to 1708.00 and 1697.10.
Comment: MACD is positive territory and Pairs above its 20MA & 55MA.
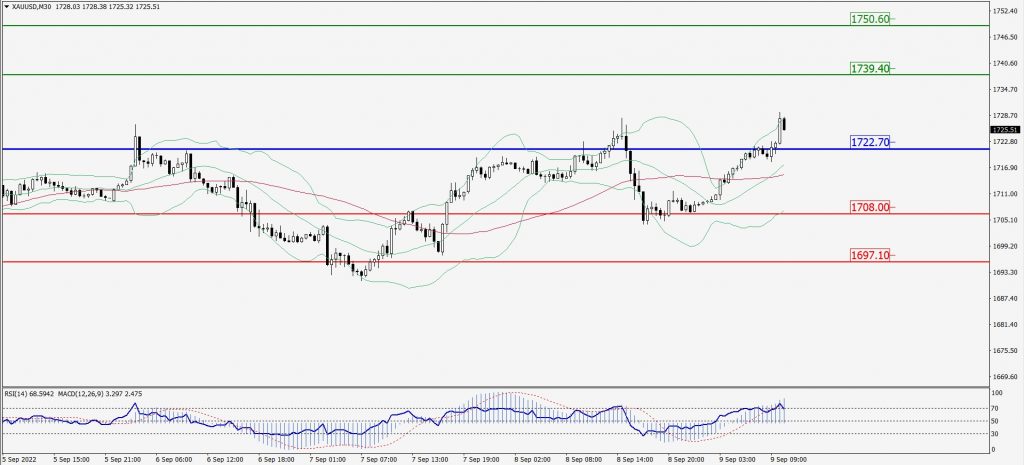
Green Lines Indicate Resistance Levels – Red Lines Indicate Support Levels
Light Blue is a Pivot Point – Black represents the price when the report was produced
Dow Jones Intraday: Support level at 31,849.00
Our pivot point is 31,849.00
Preferable Price Action: Take buy positions above pivot with targets at 32,154.00 & 32,391.00.
Alternative Price Action: Below 31,849.00 looks for further downside to 31,561.00 & 31,328.00.
Comment: RSI above 50 levels and Pairs above its 20MA & 55MA.
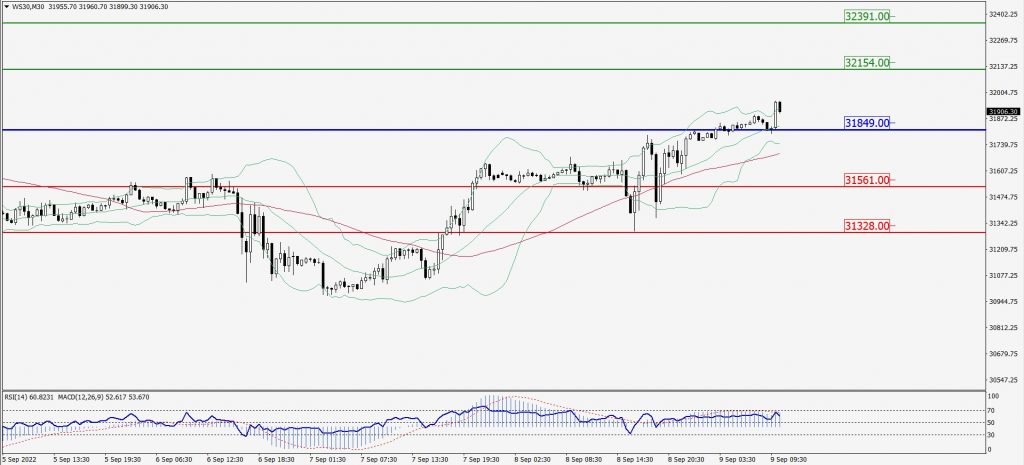
Green Lines Indicate Resistance Levels – Red Lines Indicate Support Levels
Light Blue is a Pivot Point – Black represents the price when the report was produced