Market Wrap: Stocks, Bonds, Commodities
US stocks closed lower on Monday, adding to last week’s sharp losses on nagging concerns about the Federal Reserve’s determination to aggressively hike interest rates to fight inflation even as the economy slows.
The Dow Jones Industrial Average fell 184.41 points to 32,098.99, the S&P 500 lose 27.05 points to 4,030.61 and the Nasdaq Composite subtract 124.04 points to 12,017.67.
MSCI’s index of Asia-Pacific stocks outside Japan is ascend 0.28% to 635.93 levels. Australian index higher 0.47% to 6,998.30. Japanese Nikkei Index ascend 1.14% to 28,195.58.
European stocks were positive on Tuesday, with the Stoxx Europe 50 Index rose 1.53% to 3,625.25, Germany’s DAX ascend 1.64% to 13,105.35, and France’s CAC add 1.22% to 6,298.30, and U.K.’s FTSE 100 surged 0.59% to 7,471.66.
Benchmark 10-year U.S. Treasury fell as demand for safe assets ascend again, today 10-year bond yields a negative 1.86% to 3.0520.
Oil prices fell on Tuesday after notching their highest gains in more than a month in the previous session, as global inflation worries overshadowed the prospect of possible OPEC+ output cuts.
Spot Brent crude oil subtract 0.14% to $102.78 per barrel. US West Texas Intermediate crude is down 0.04% to $96.97 a barrel.
The yellow metal gold is decline 0.10% to 1,748.05 dollars per ounce.
Market Wrap: Forex
The U.S. dollar edged lower in early European trade Tuesday, falling back from a 20-year peak, as attention turns towards Europe, with Wednesday’s Eurozone inflation data likely to point to an aggressive ECB interest rate hike next month.
Today, the U.S. dollar index measures the Greenback against a trade-weighted basket of six major currencies, which is fell 0.30% to 108.477.
The Euro US Dollar (EUR/USD) is a widely traded pair that is up 0.27% today. This left the pair trading around $1.00240.
The Japanese yen was positive against the U.S. dollar on Tuesday as the stock up. Today USD/JPY is drop 0.31% to 138.250 level.
Another commodity-related currency positive against the U.S dollar, AUD/USD gain 0.51% to 0.69380, and NZD/USD up 0.46 to 0.61800 level.
EUR/USD Intraday: In a consolidation zone
Our pivot point is at 1.00170
Preferable Price Action: Take sell positions below pivot level with targets at 0.99630 & 0.99260 in extension.
Alternative Price Action: Above pivot looks for a further upside to 1.00630 & 1.00990.
Comment: RSI at 50 levels and Pairs below 20MA.
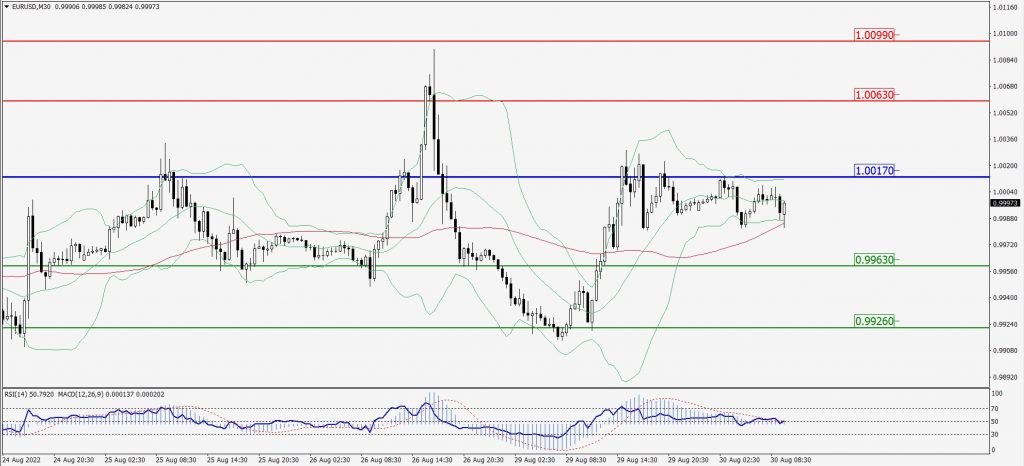
Green Lines Indicate Resistance Levels – Red Lines Indicate Support Levels
Light Blue is a Pivot Point – Black represents the price when the report was produced
GBP/USD Intraday: Trend on the upside
Our pivot point is at 1.16960
Preferable Price Action: Buy positions above pivot with targets at 1.17860 & 1.18720 in extension.
Alternative Price Action: The price below pivot would call for further downside to 1.16130 & 1.15250.
Comment: RSI above 50 levels and Pairs above 55MA.
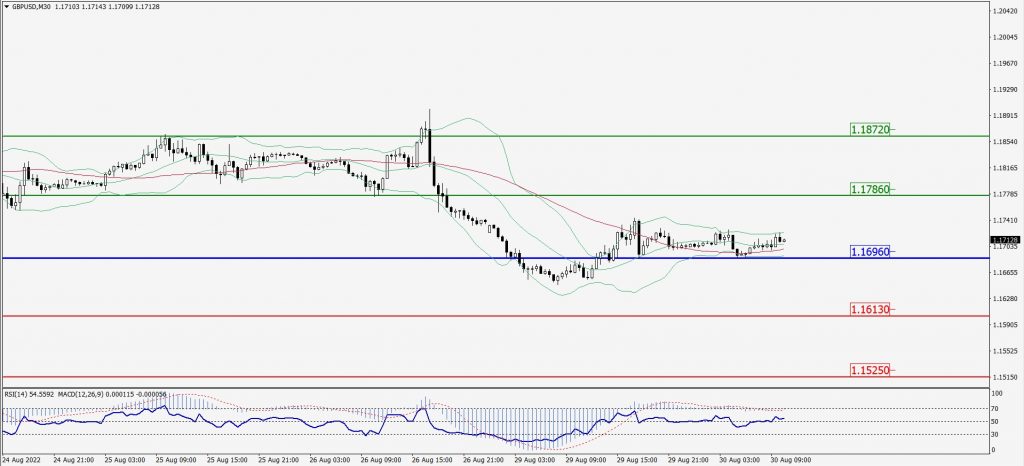
Green Lines Indicate Resistance Levels – Red Lines Indicate Support Levels
Light Blue is a Pivot Point – Black represents the price when the report was produced
USD/JPY Intraday: Major support level at 138.480
Our pivot point is at 138.480
Preferable Price Action: Buy position above pivot with the target at 139.450 and 140.100 in extension.
Alternative Price Action: The downside breakout of the pivot would call for 137.620 and 136.930.
Comment: MACD is positive territory and Pairs above its 20MA.
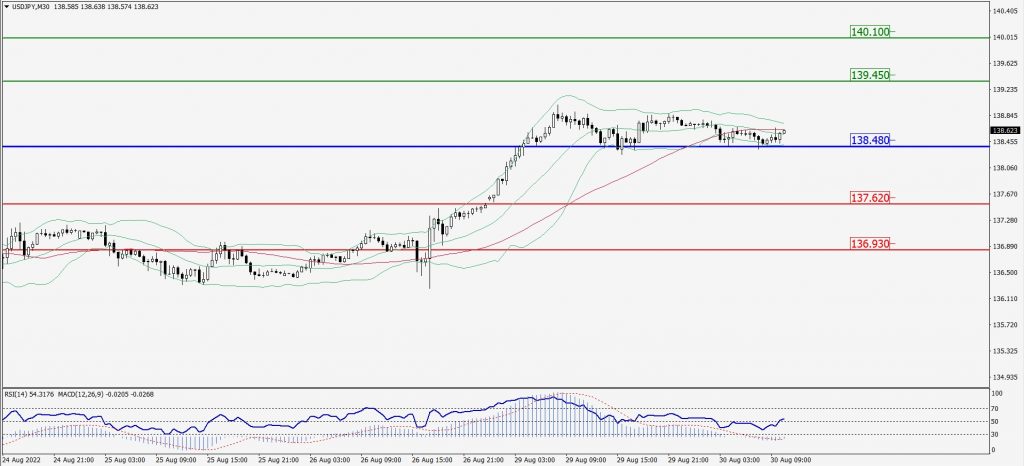
Green Lines Indicate Resistance Levels – Red Lines Indicate Support Levels
Light Blue is a Pivot Point – Black represents the price when the report was produced
AUD/USD Intraday: Trend on the upside
Our pivot point is at 0.69020
Preferable Price Action: Buy Positions above pivot with targets at 0.69590 & 0.69990 in extension.
Alternative Price Action: Below pivot looks for a further downside with 0.68570 & 0.68250 as targets.
Comment: RSI above 50 levels and Pairs above its 20MA & 55MA.
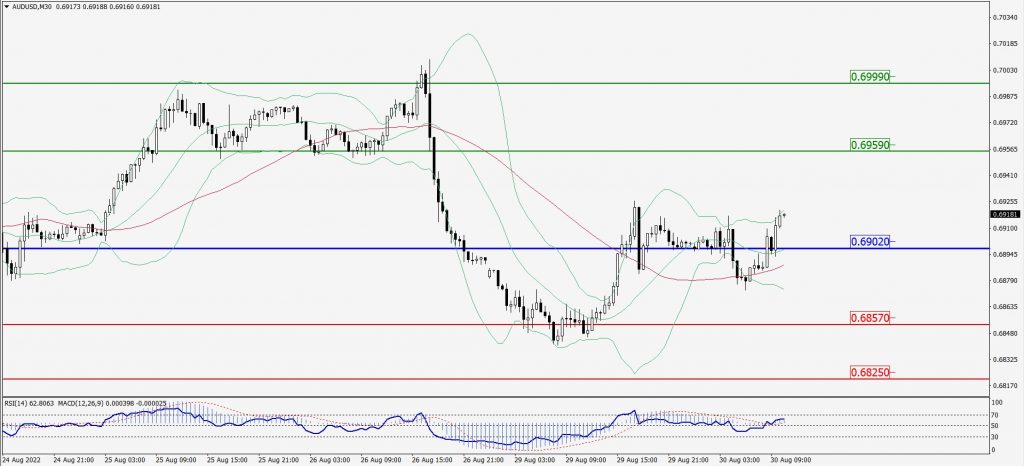
Green Lines Indicate Resistance Levels – Red Lines Indicate Support Levels
Light Blue is a Pivot Point – Black represents the price when the report was produced
CRUDEOIL Intraday: Support level at 96.36
Our pivot point is at 96.36
Preferable Price Action: Above pivots buy oil with 98.52 & 99.52 as targets.
Alternative Price Action: Sell crude below pivot with targets at 94.76 and 93.47 in extension.
Comment: MACD is in the positive territory and Pairs above its 20MA & 55MA.
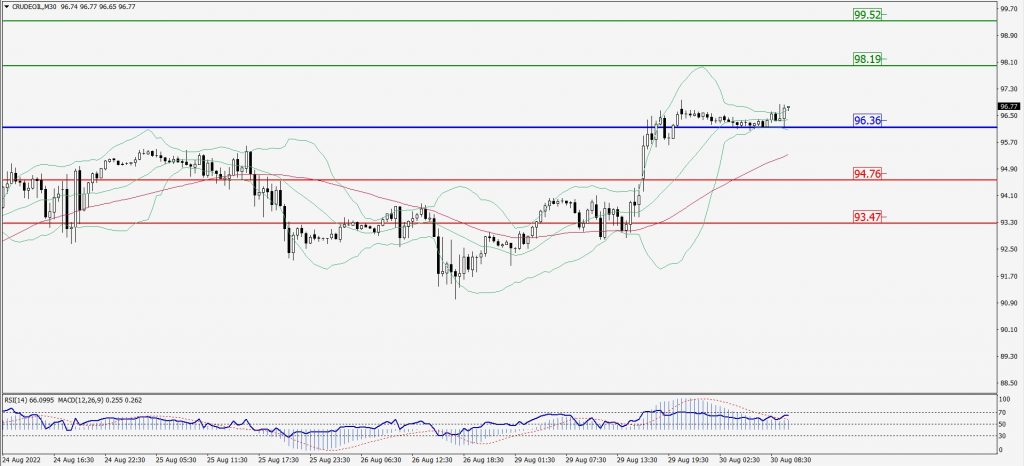
Green Lines Indicate Resistance Levels – Red Lines Indicate Support Levels
Light Blue is a Pivot Point – Black represents the price when the report was produced
XAU/USD Intraday: Trend on the downside
Our pivot point is 1740.00
Preferable Price Action: Further downside to 1720.90 and 1706.80
Alternative Price Action: If the price gives an upside breakout of a pivot, then the price extends to 1755.90 and 1768.60.
Comment: MACD is negative territory and Pairs below 20MA.
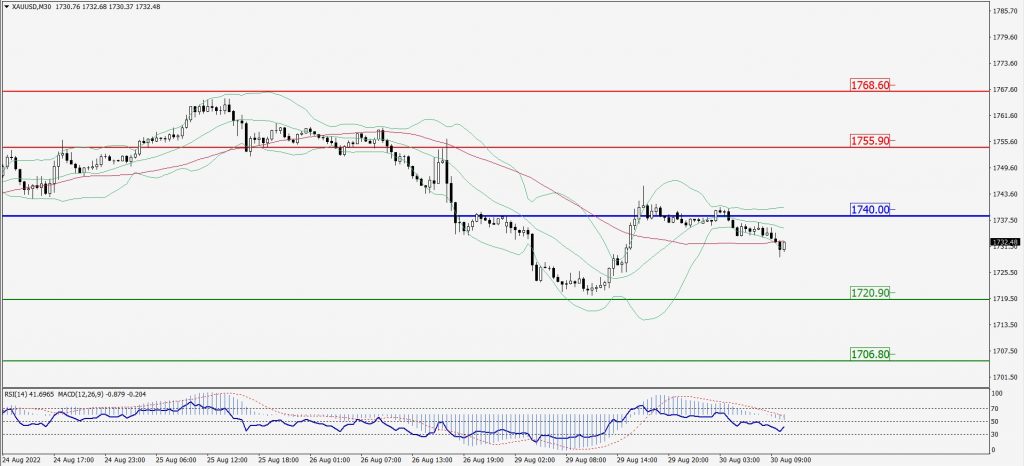
Green Lines Indicate Resistance Levels – Red Lines Indicate Support Levels
Light Blue is a Pivot Point – Black represents the price when the report was produced
Dow Jones Intraday: Trend on the upside
Our pivot point is 32,173.00
Preferable Price Action: Take buy positions above pivot with targets at 32,530.00 & 32,799.00.
Alternative Price Action: Below 32,173.00 looks for further downside to 31,887.00 & 31,627.00.
Comment: RSI above 50 levels and Pairs above its 20MA & 55MA.
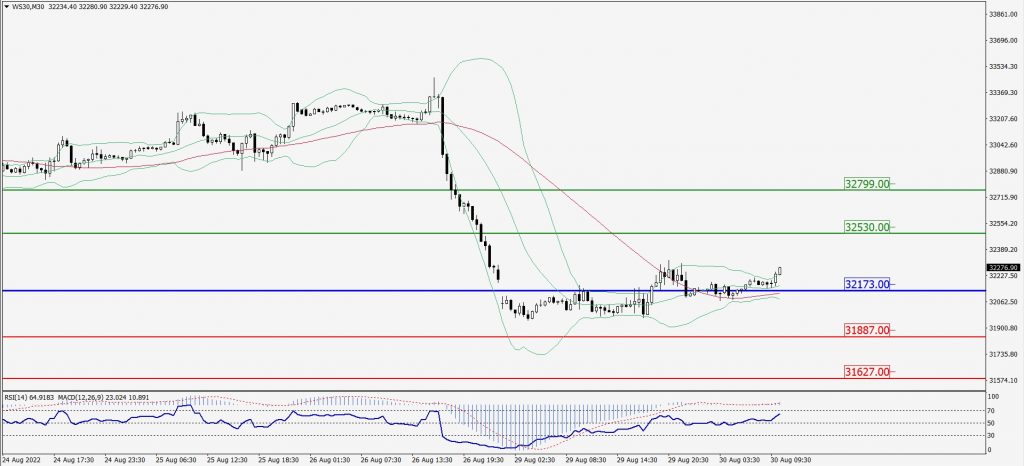
Green Lines Indicate Resistance Levels – Red Lines Indicate Support Levels
Light Blue is a Pivot Point – Black represents the price when the report was produced