Market Wrap: Stocks, Bonds, Commodities
Stocks pummelled Friday after Federal Reserve Chair Jerome Powell said in his Jackson Hole speech the central bank won’t back off in its fight against rapid inflation.
The Dow Jones Industrial Average fell 1008.38 points to 32,283.40, the S&P 500 lose 141.46 points to 4,057.66 and the Nasdaq Composite subtract 497.55 points to 12,141.71.
MSCI’s index of Asia-Pacific stocks outside Japan is drop 1.69% to 633.92 levels. Australian index lower 1.95% to 6,965.50. Japanese Nikkei Index drop 2.66% to 27,878.96.
European stocks were negative on Monday, with the Stoxx Europe 50 Index fell 1.43% to 3,552.05, Germany’s DAX drop 1.31% to 12,801.37, and France’s CAC drop 1.39% to 6,185.76, and U.K.’s FTSE 100 slipped 0.70% to 7,427.31.
Benchmark 10-year U.S. Treasury fell as demand for safe assets ascend again, today 10-year bond yields a positive 2.59% to 3.1140.
Oil prices were mixed on Monday as investors balanced expectations the OPEC will cut output to support prices against concerns sparked by Federal Reserve Chairman Jerome Powell saying the United States will face slow growth “for some time”.
Spot Brent crude oil add 1.24% to $100.23 per barrel. US West Texas Intermediate crude is up 1.28% to $94.26 a barrel.
The yellow metal gold is decline 1.00% to 1,732.30 dollars per ounce.
Market Wrap: Forex
The U.S dollar climbed to a 20-year high against other major currencies on Monday after Federal Reserve Chair Jerome Powell signalled interest rates would be kept higher for longer to bring down soaring inflation.
Today, the U.S. dollar index measures the Greenback against a trade-weighted basket of six major currencies, which is rose 0.49% to 109.287.
The Euro US Dollar (EUR/USD) is a widely traded pair that is down 0.32% today. This left the pair trading around $0.99300.
The Japanese yen was positive against the U.S. dollar on Monday as the stock up. Today USD/JPY is ascend 0.91% to 138.780 level.
Another commodity-related currency negative against the U.S dollar, AUD/USD lose 0.57% to 0.69510, and NZD/USD down 0.42 to 0.61060 level.
EUR/USD Intraday: In a consolidation zone
Our pivot point is at 0.99750
Preferable Price Action: Take sell positions below pivot level with targets at 0.99070 & 0.98580 in extension.
Alternative Price Action: Above pivot looks for a further upside to 1.00300 & 1.00780.
Comment: RSI at 50 levels and Pairs below 55MA.
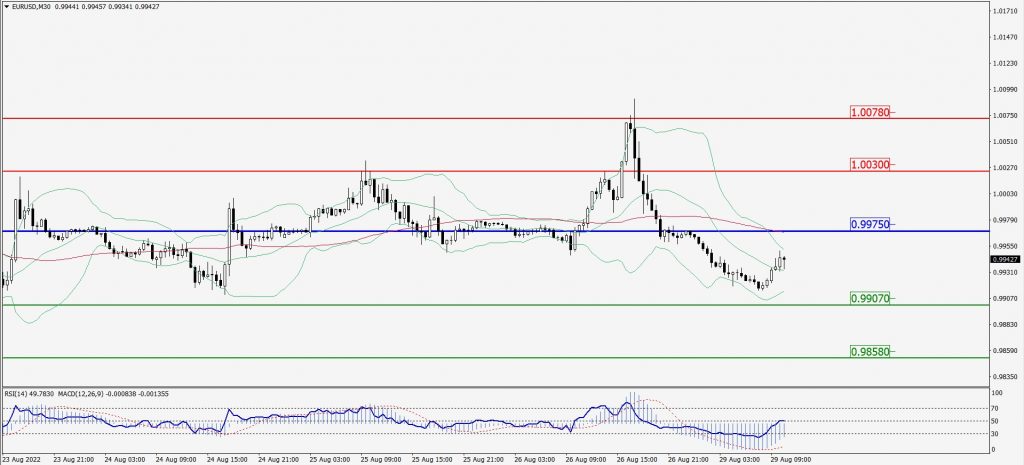
Green Lines Indicate Resistance Levels – Red Lines Indicate Support Levels
Light Blue is a Pivot Point – Black represents the price when the report was produced
GBP/USD Intraday: Trend on the downside
Our pivot point is at 1.17070
Preferable Price Action: Sell positions below pivot with targets at 1.16230 & 1.15650 in extension.
Alternative Price Action: The price above pivot would call for further upside to 1.17780 & 1.18450.
Comment: RSI below 50 levels and Pairs below 55MA.
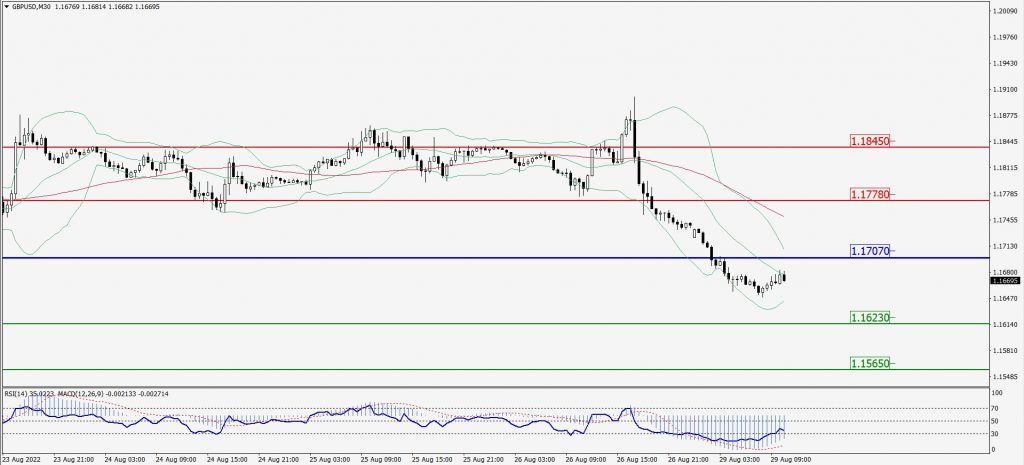
Green Lines Indicate Resistance Levels – Red Lines Indicate Support Levels
Light Blue is a Pivot Point – Black represents the price when the report was produced
USD/JPY Intraday: Major trend on the upside
Our pivot point is at 138.480
Preferable Price Action: Buy position above pivot with the target at 139.450 and 140.100 in extension.
Alternative Price Action: The downside breakout of the pivot would call for 137.620 and 136.930.
Comment: MACD is positive territory and Pairs above its 20MA & 55MA.
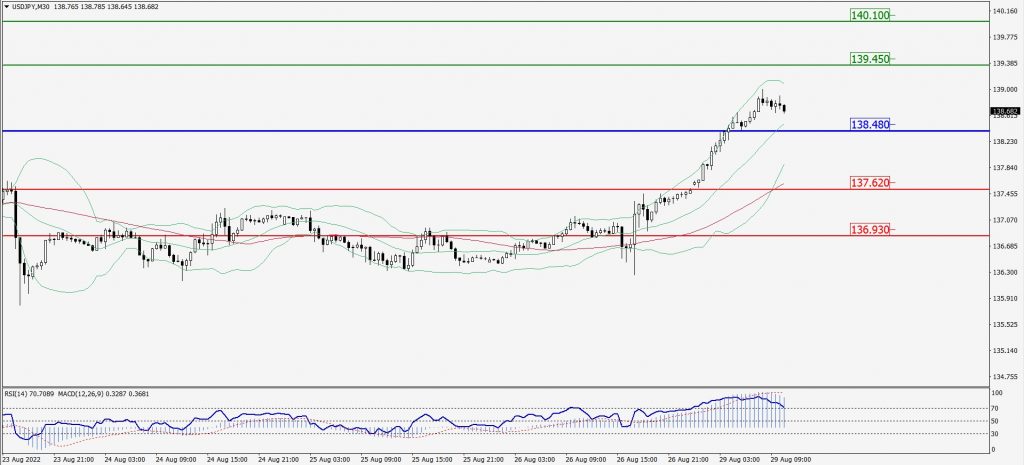
Green Lines Indicate Resistance Levels – Red Lines Indicate Support Levels
Light Blue is a Pivot Point – Black represents the price when the report was produced
AUD/USD Intraday: Trend on the downside
Our pivot point is at 0.68770
Preferable Price Action: Sell Positions below pivot with targets at 0.68320 & 0.68000 in extension.
Alternative Price Action: Above pivot looks for a further upside with 0.69150 & 0.69470 as targets.
Comment: RSI below 50 levels and Pairs below its 20MA & 55MA.
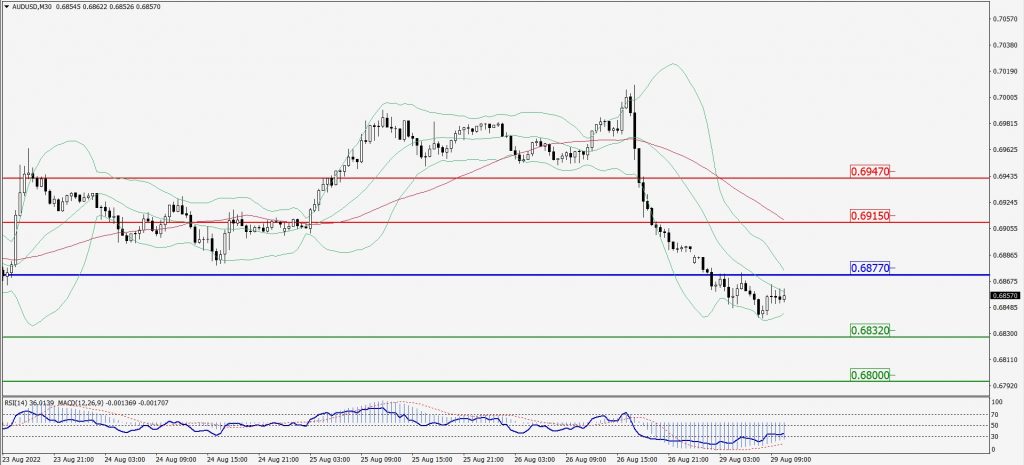
Green Lines Indicate Resistance Levels – Red Lines Indicate Support Levels
Light Blue is a Pivot Point – Black represents the price when the report was produced
CRUDEOIL Intraday: Support level at 93.22
Our pivot point is at 93.22
Preferable Price Action: Above pivots buy oil with 95.01 & 96.43 as targets.
Alternative Price Action: Sell crude below pivot with targets at 91.52 and 90.30 in extension.
Comment: MACD is in the positive territory and Pairs above its 20MA & 55MA.
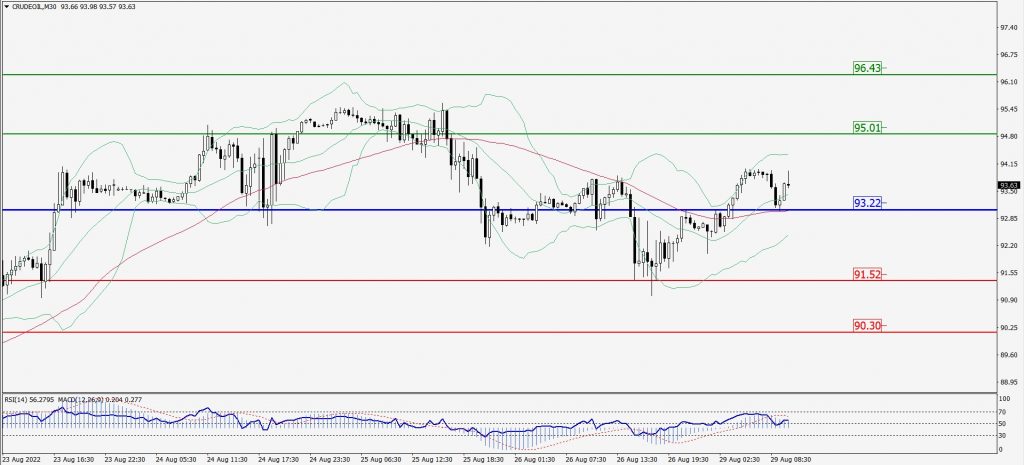
Green Lines Indicate Resistance Levels – Red Lines Indicate Support Levels
Light Blue is a Pivot Point – Black represents the price when the report was produced
XAU/USD Intraday: Trend on the downside
Our pivot point is 1729.00
Preferable Price Action: Further downside to 1710.00 and 1696.50
Alternative Price Action: If the price gives an upside breakout of a pivot, then the price extends to 1745.40 and 1759.50.
Comment: MACD is negative territory and Pairs below its 20MA & 55MA.
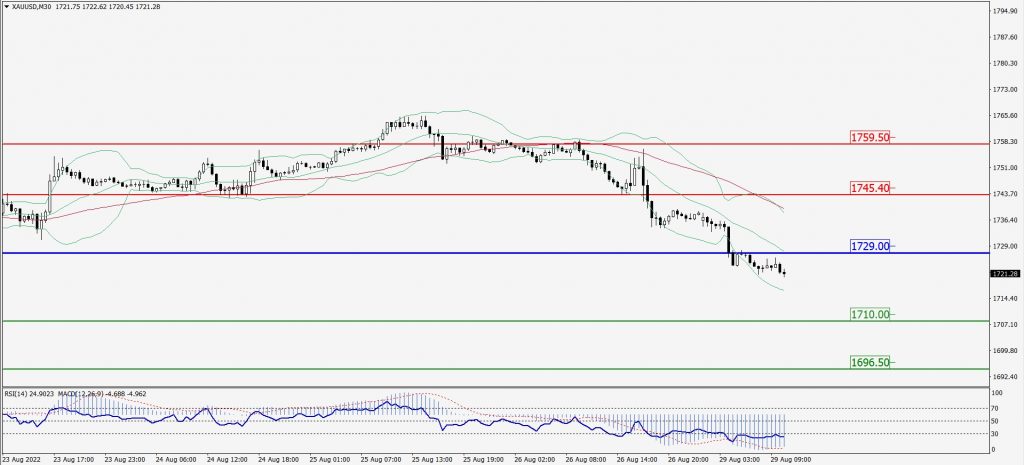
Green Lines Indicate Resistance Levels – Red Lines Indicate Support Levels
Light Blue is a Pivot Point – Black represents the price when the report was produced
Dow Jones Intraday: Trend on the downside
Our pivot point is 32,298.00
Preferable Price Action: Take sell positions below pivot with targets at 31,911.00 & 31,632.00.
Alternative Price Action: Above 32,298.00 looks for further upside to 32,640.00 & 32,902.00.
Comment: RSI below 50 levels and Pairs below 55MA.
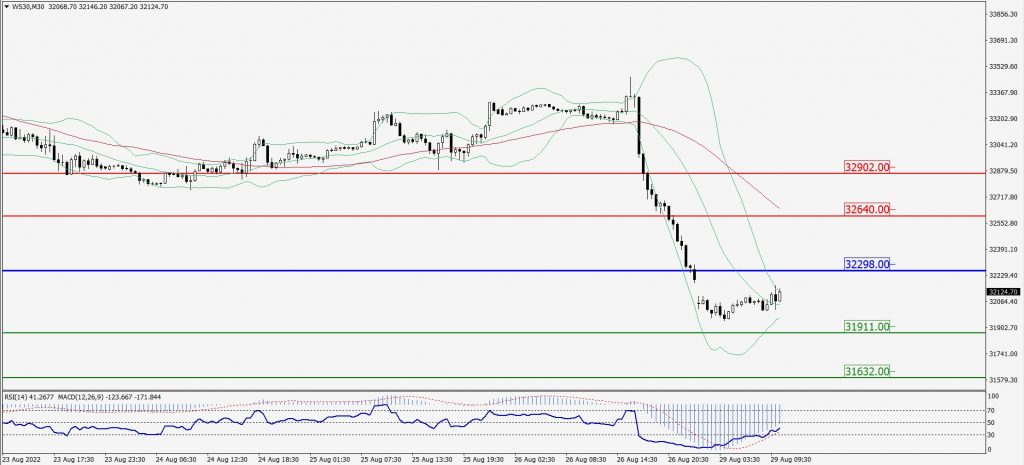
Green Lines Indicate Resistance Levels – Red Lines Indicate Support Levels
Light Blue is a Pivot Point – Black represents the price when the report was produced